Feature Introduction
Currently there are 5 core feature components covered under Rarity gap analysis report. These components will be tappout respectively as a new tab in the dash web application.
General Metrics
Component tab that covers general metrics used to evaluate model performance.
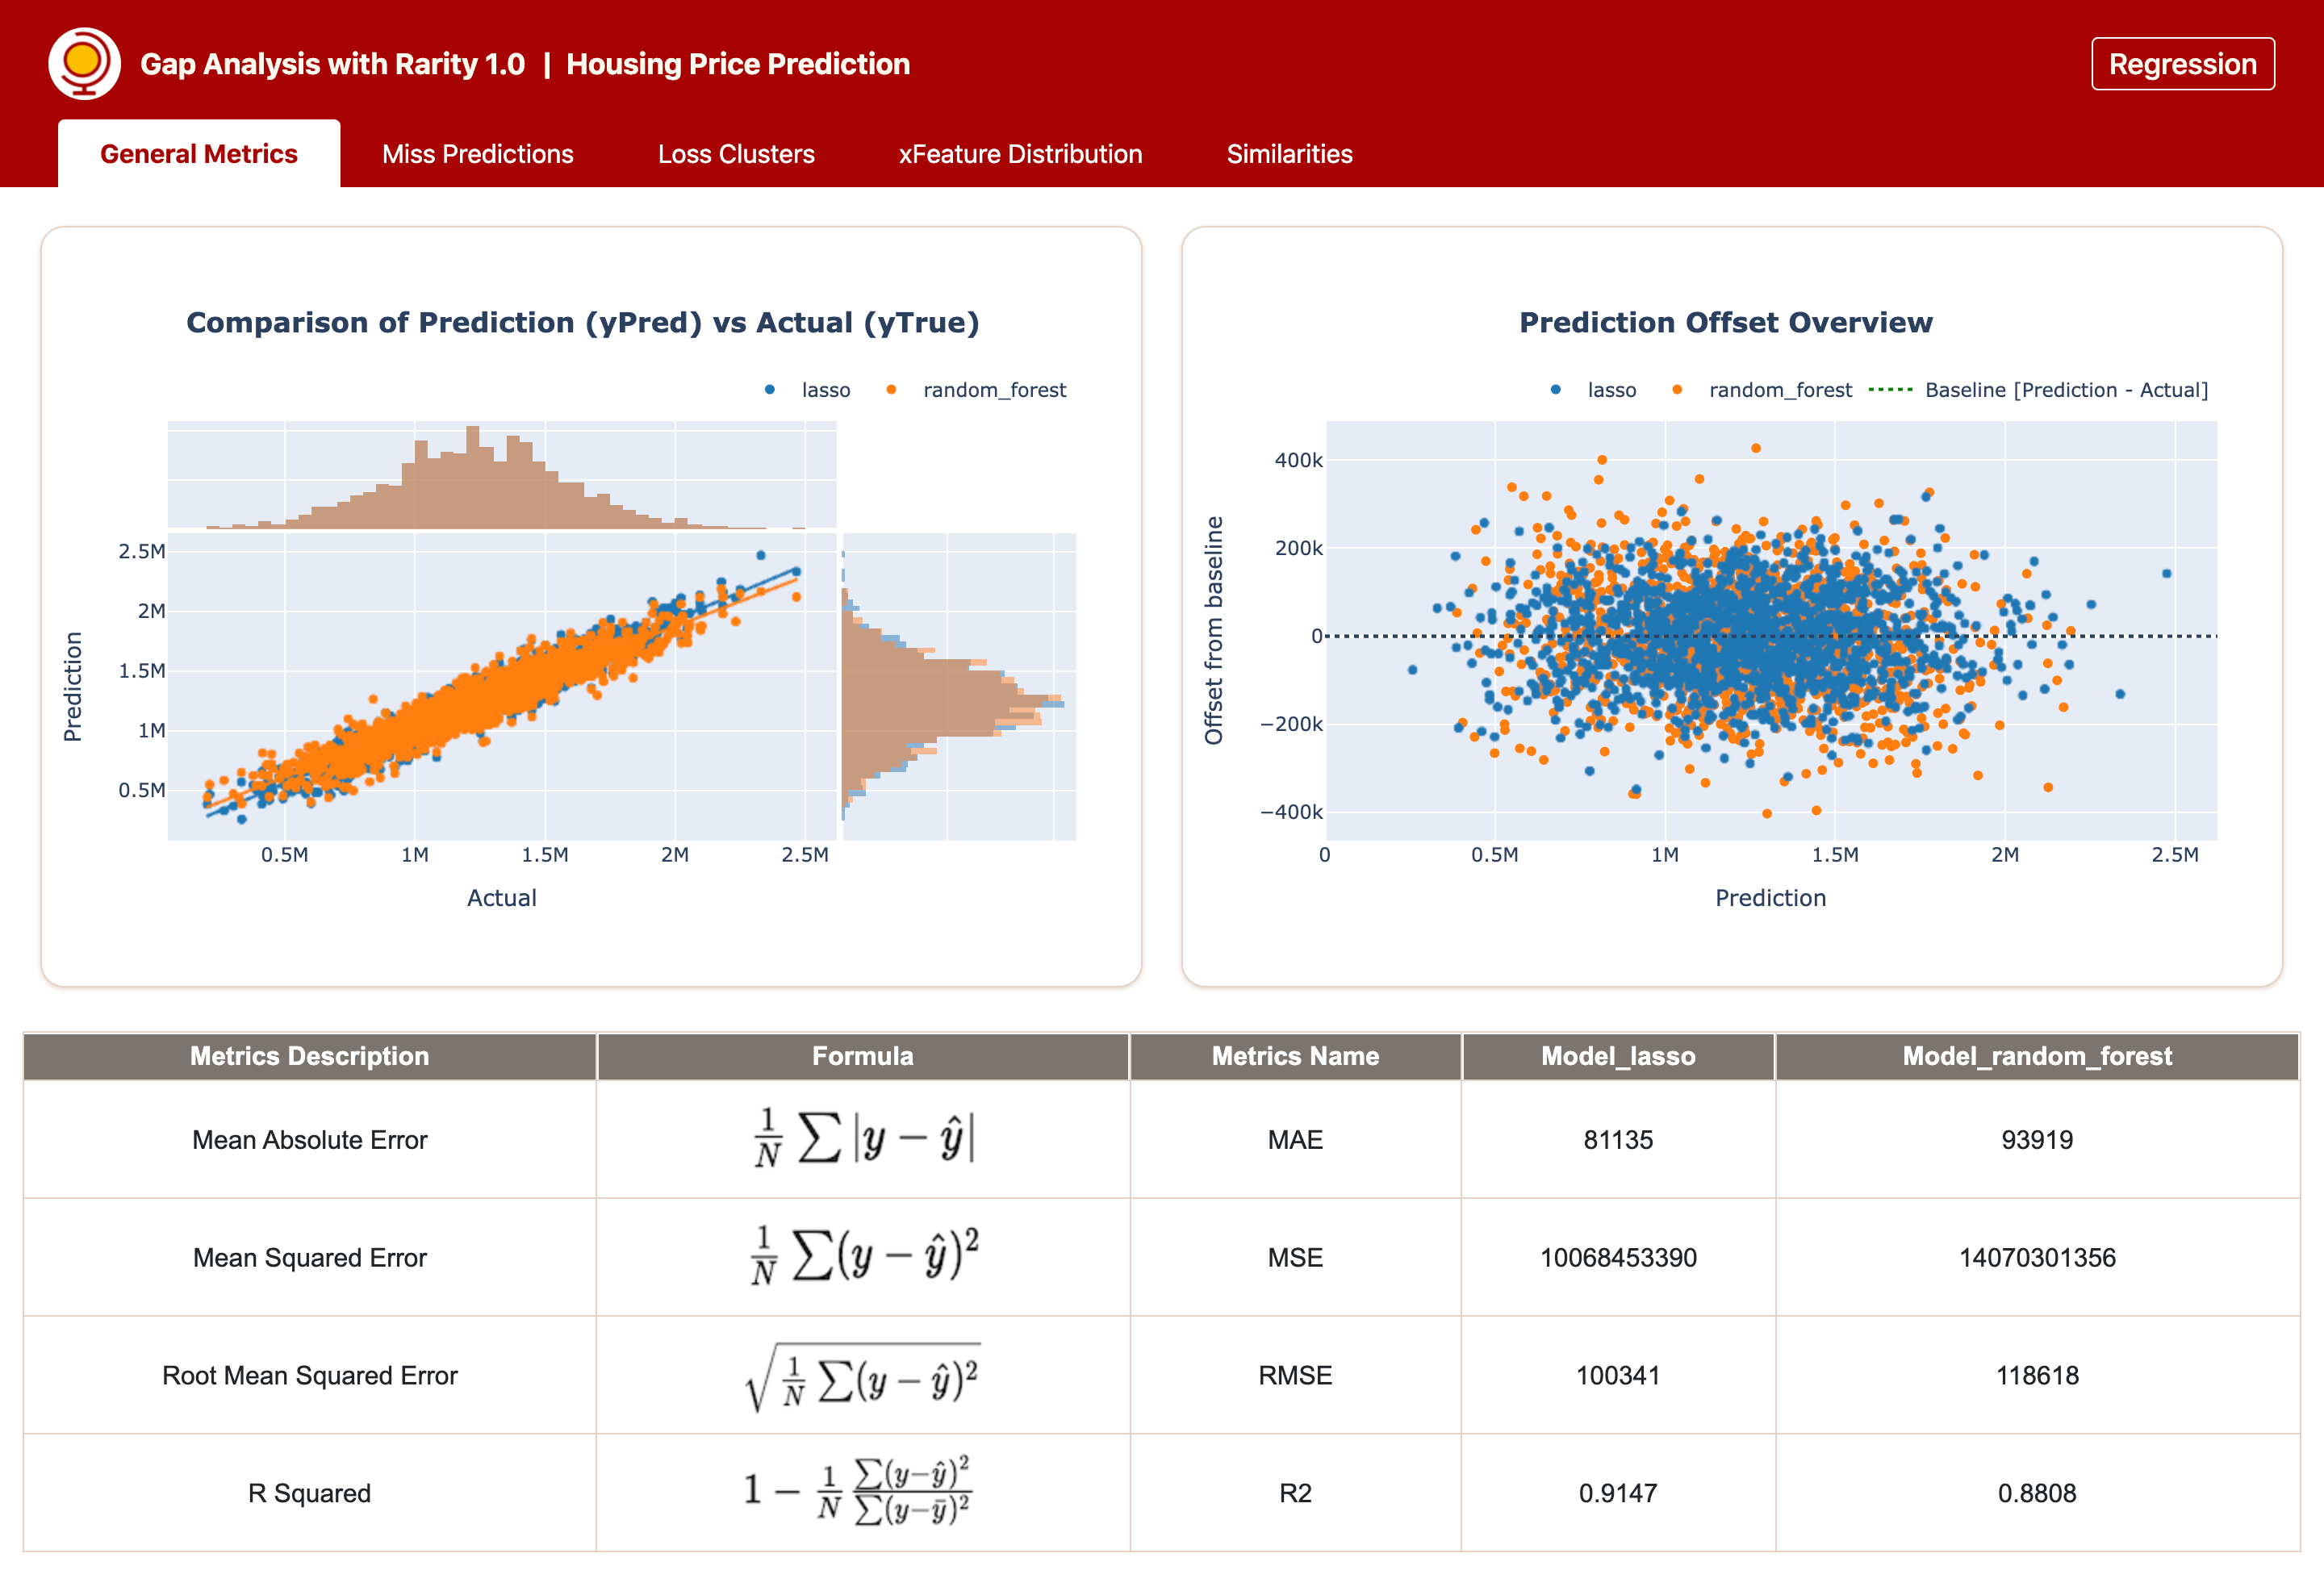
On
Regressiontask, metrics covered as followsscatter plots of Prediction vs Actual
scatter plots of Offset vs Prediction
Mean Absolute Error
Mean Squared Error
Root Mean Squared Error
R Squared
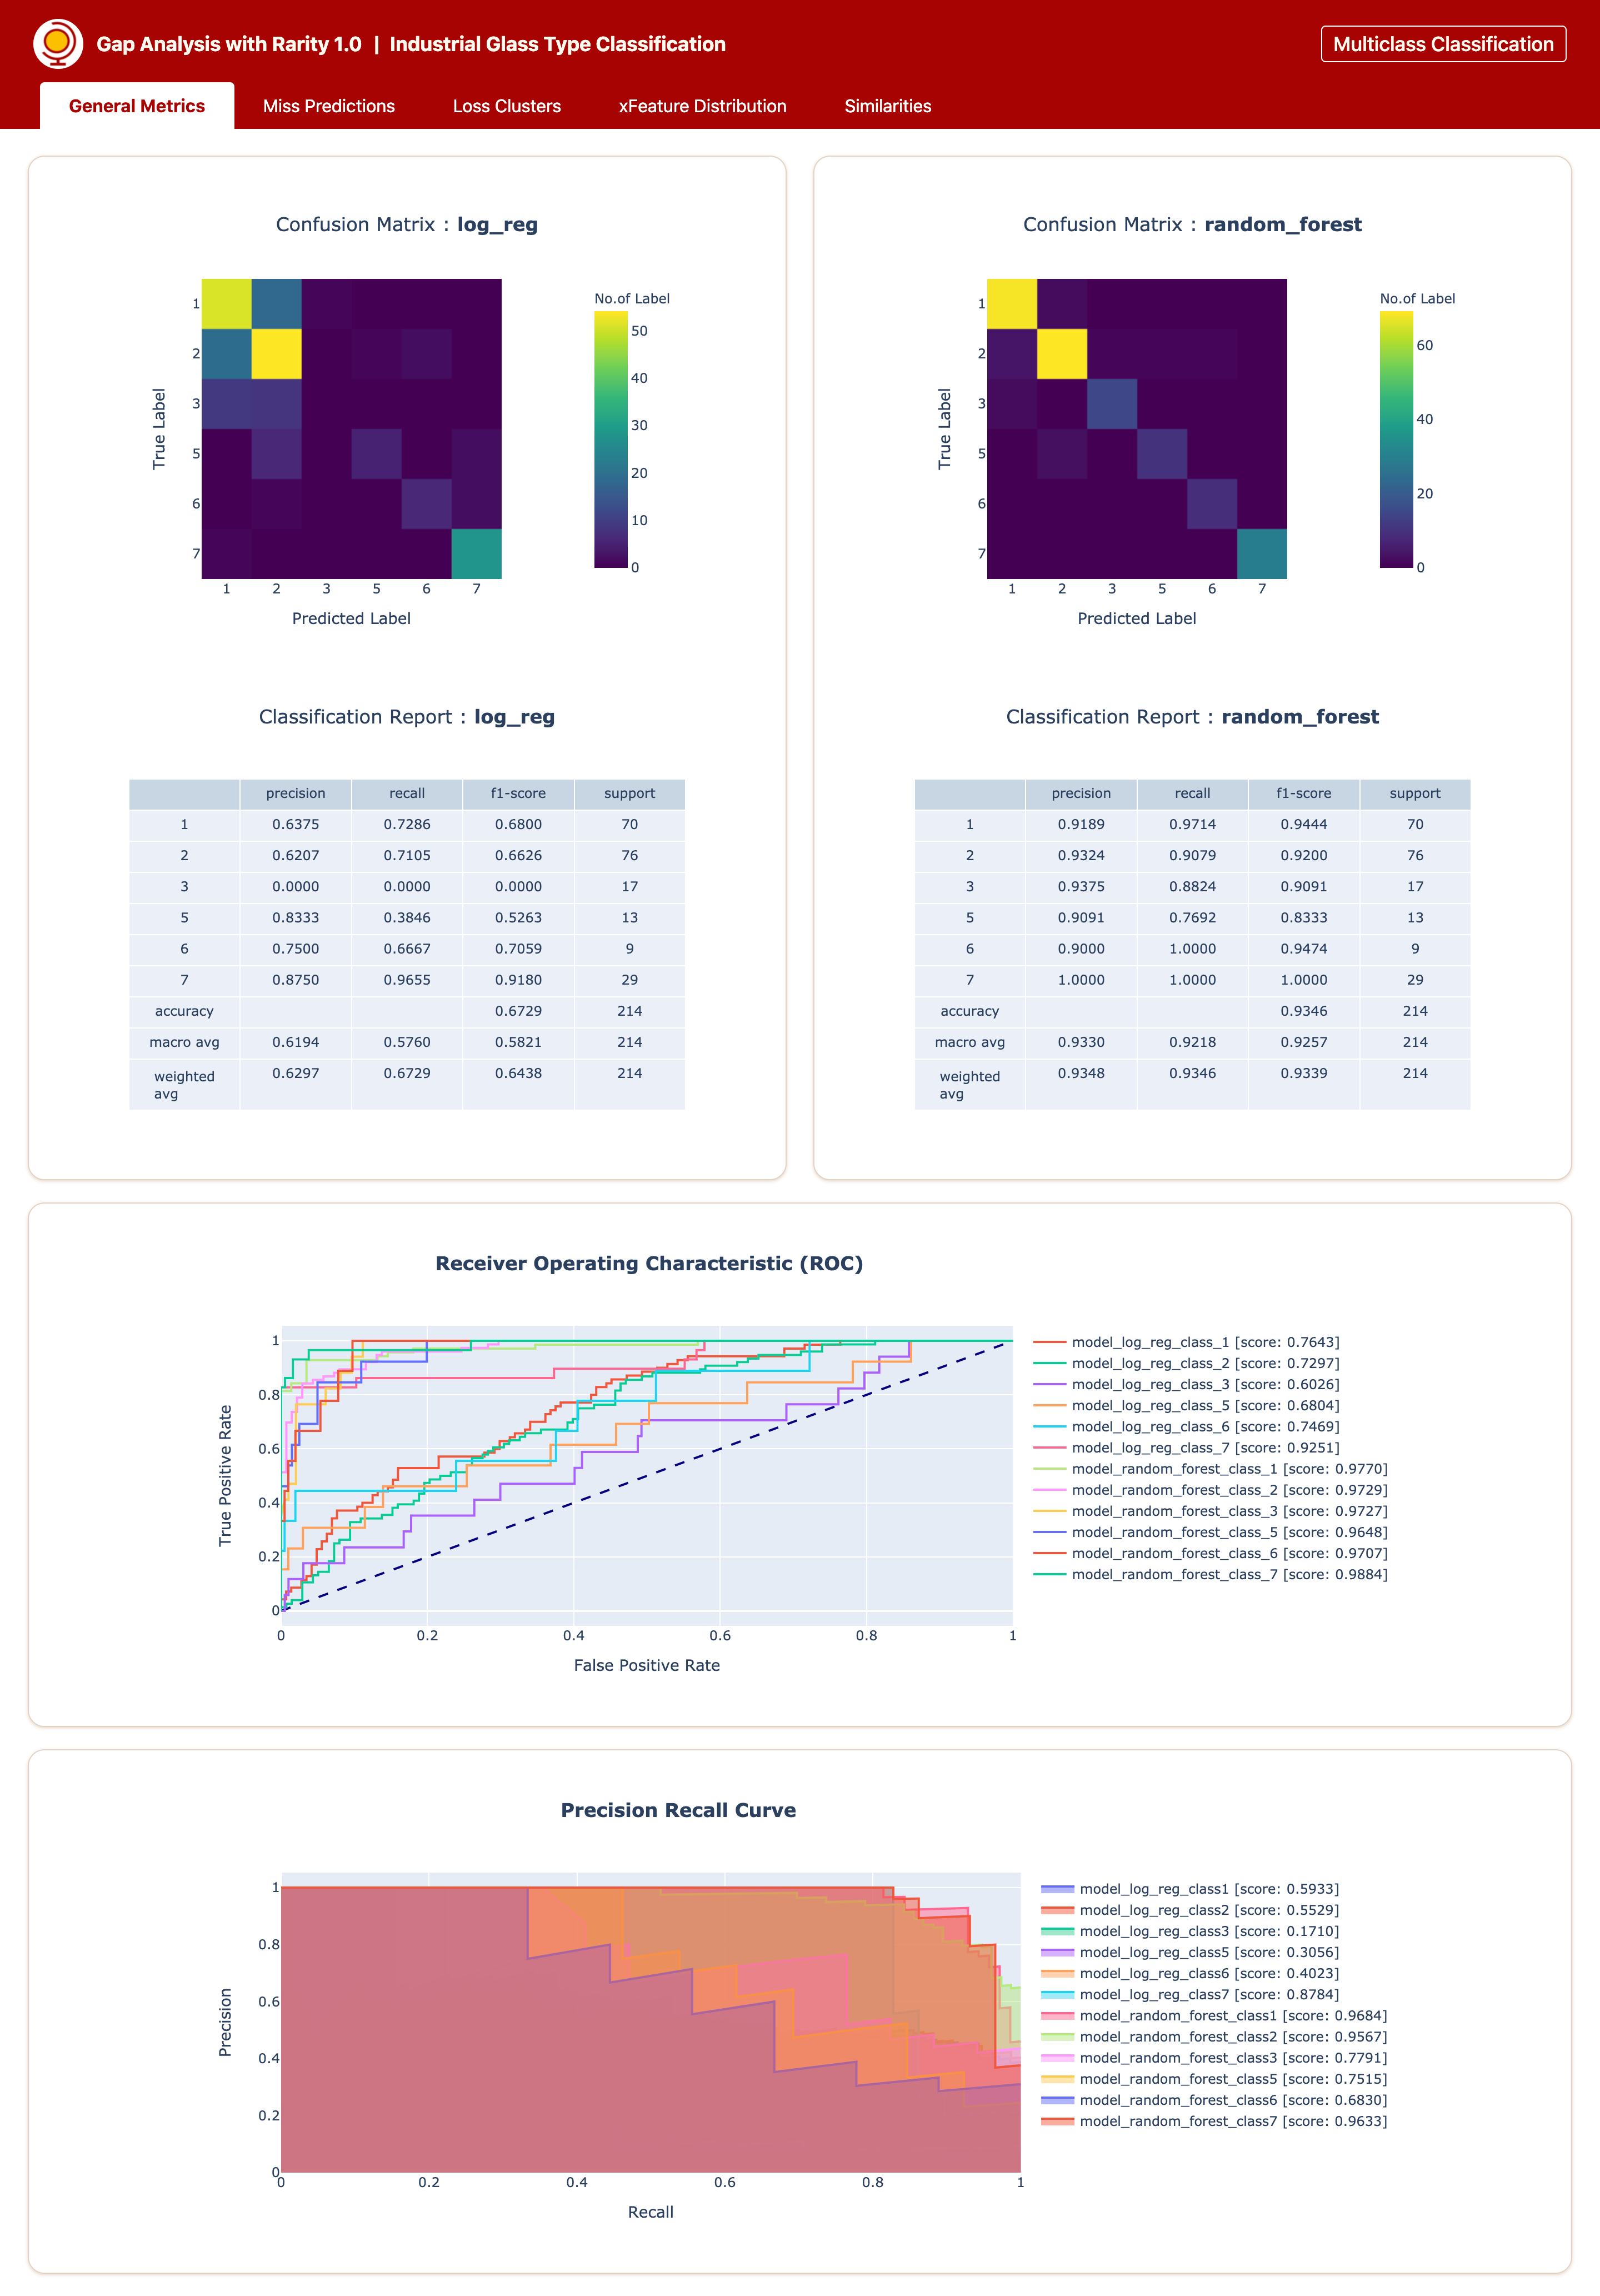
On
Classifciationtask, metrics covered as followsConfustion Matrix
Classification Report
ROC-AUC curve
Precision-Recall curve
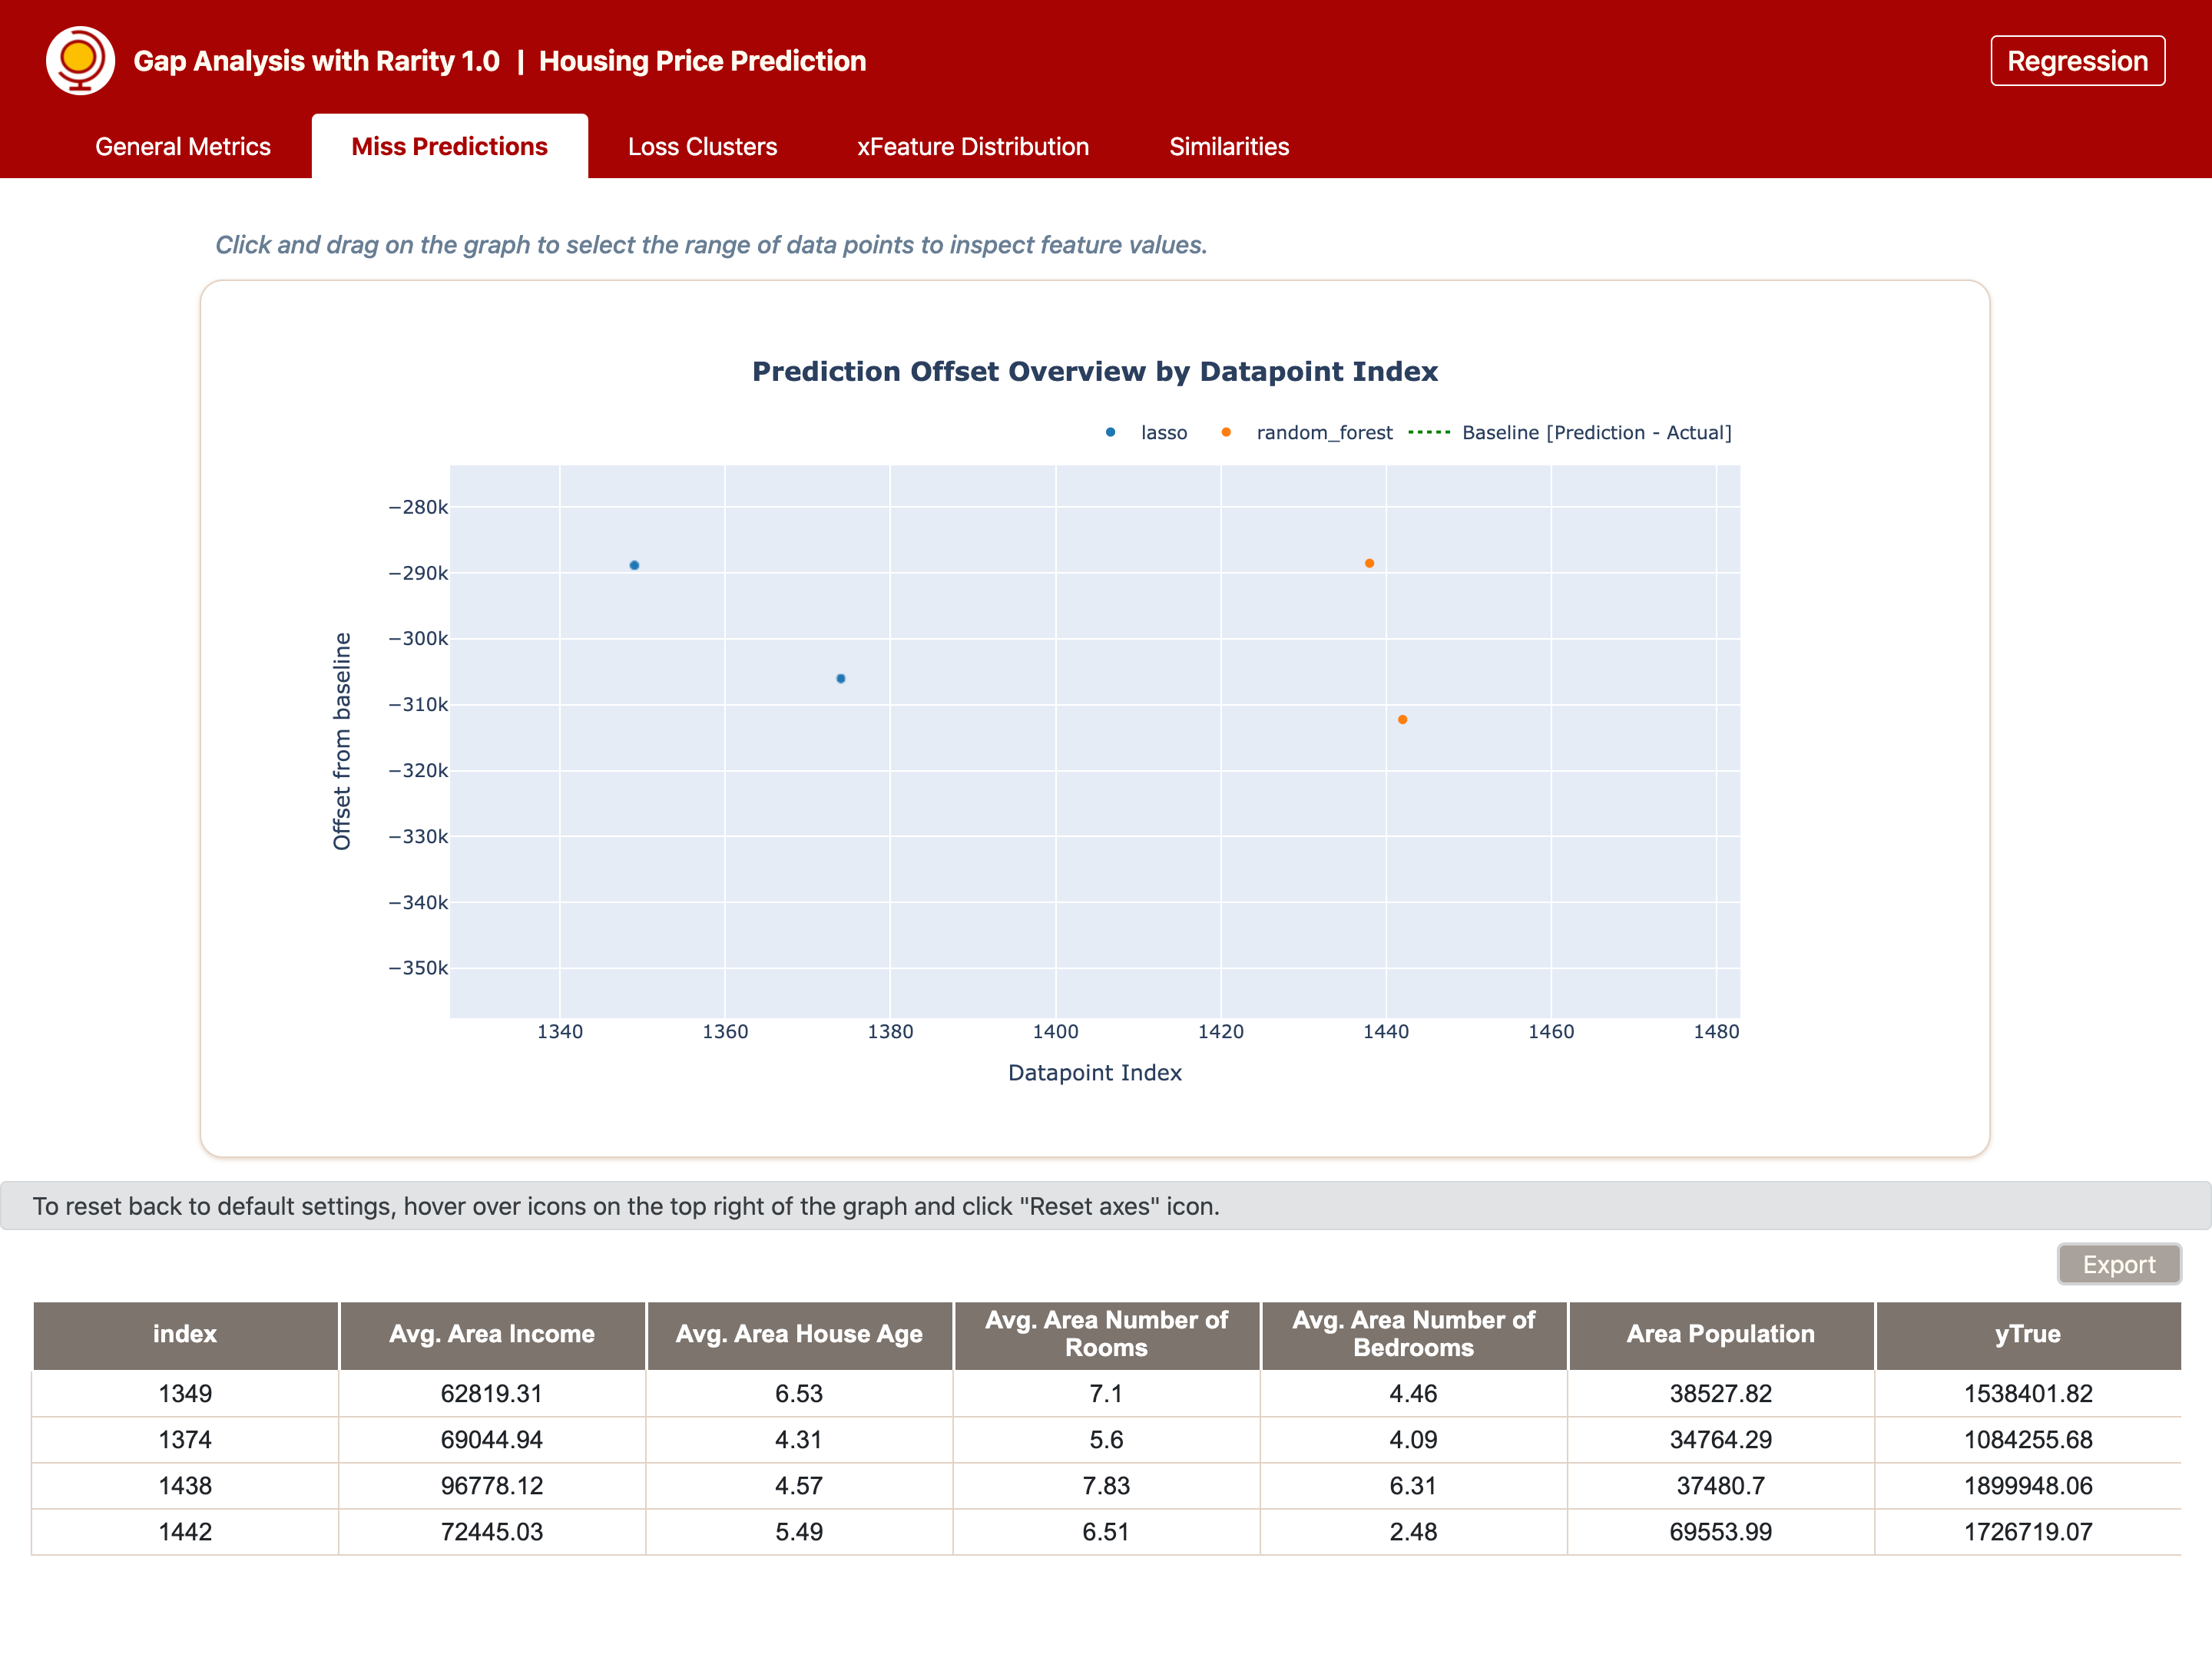
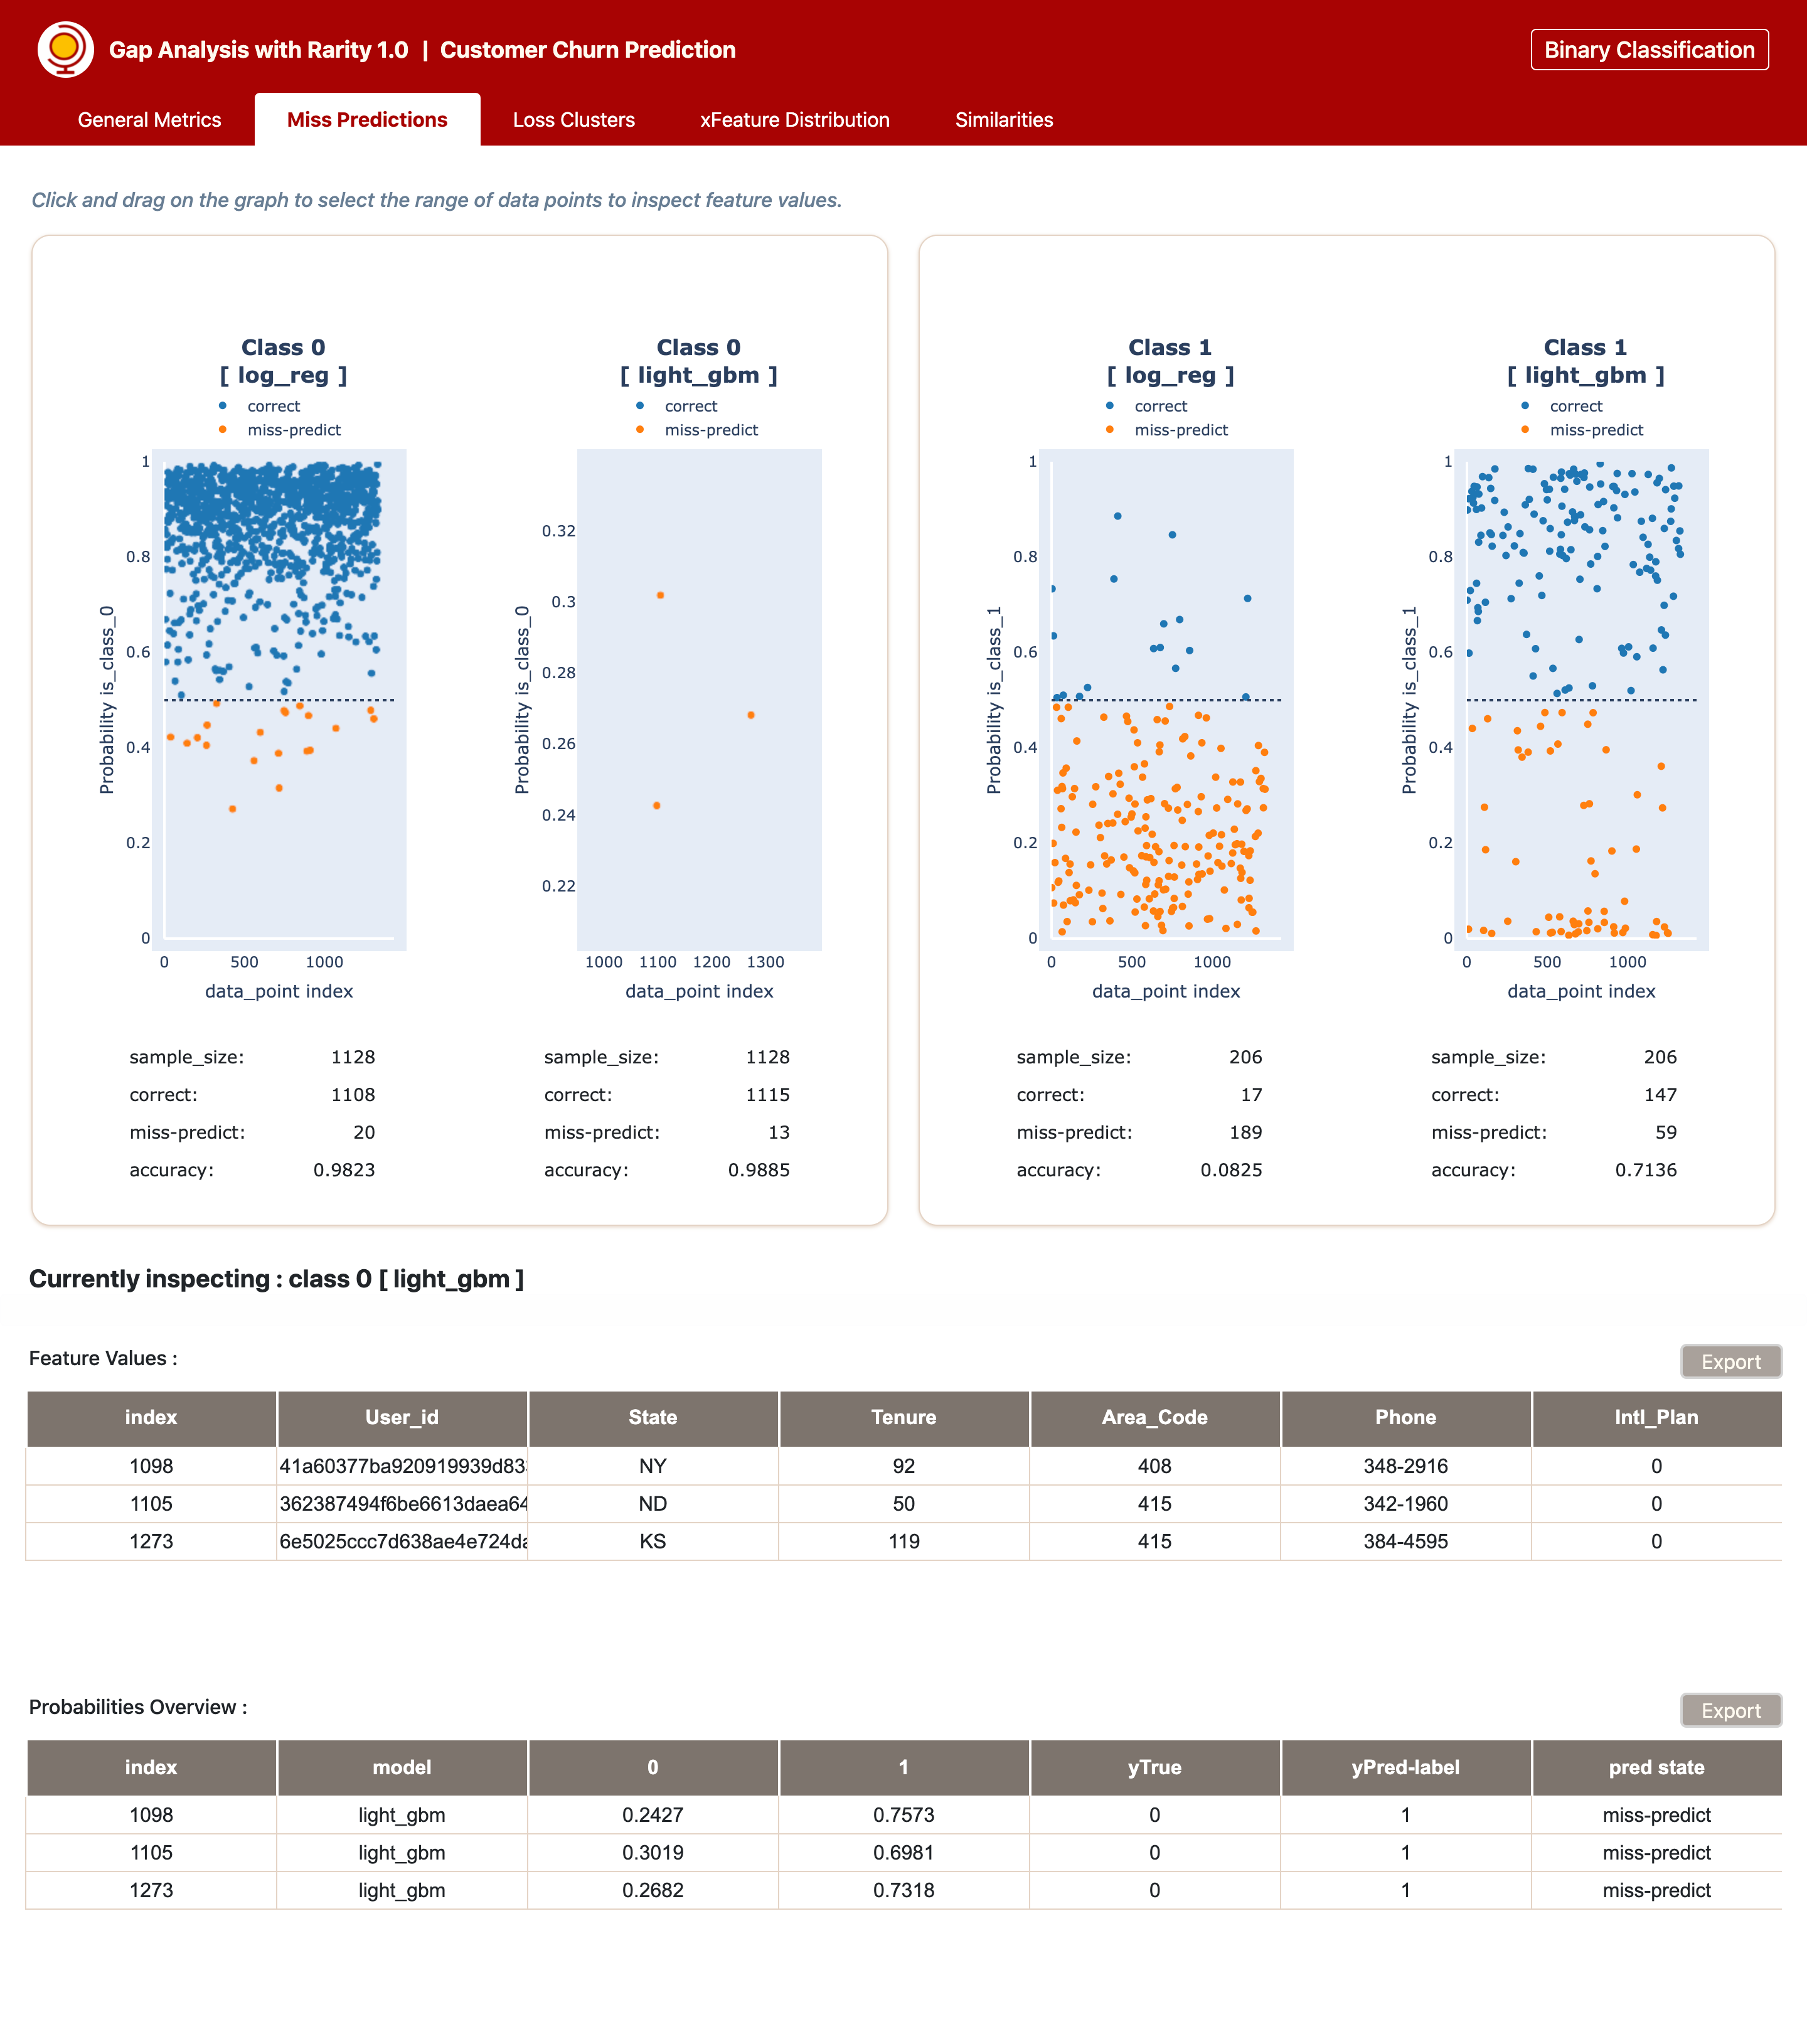
Miss Predictions
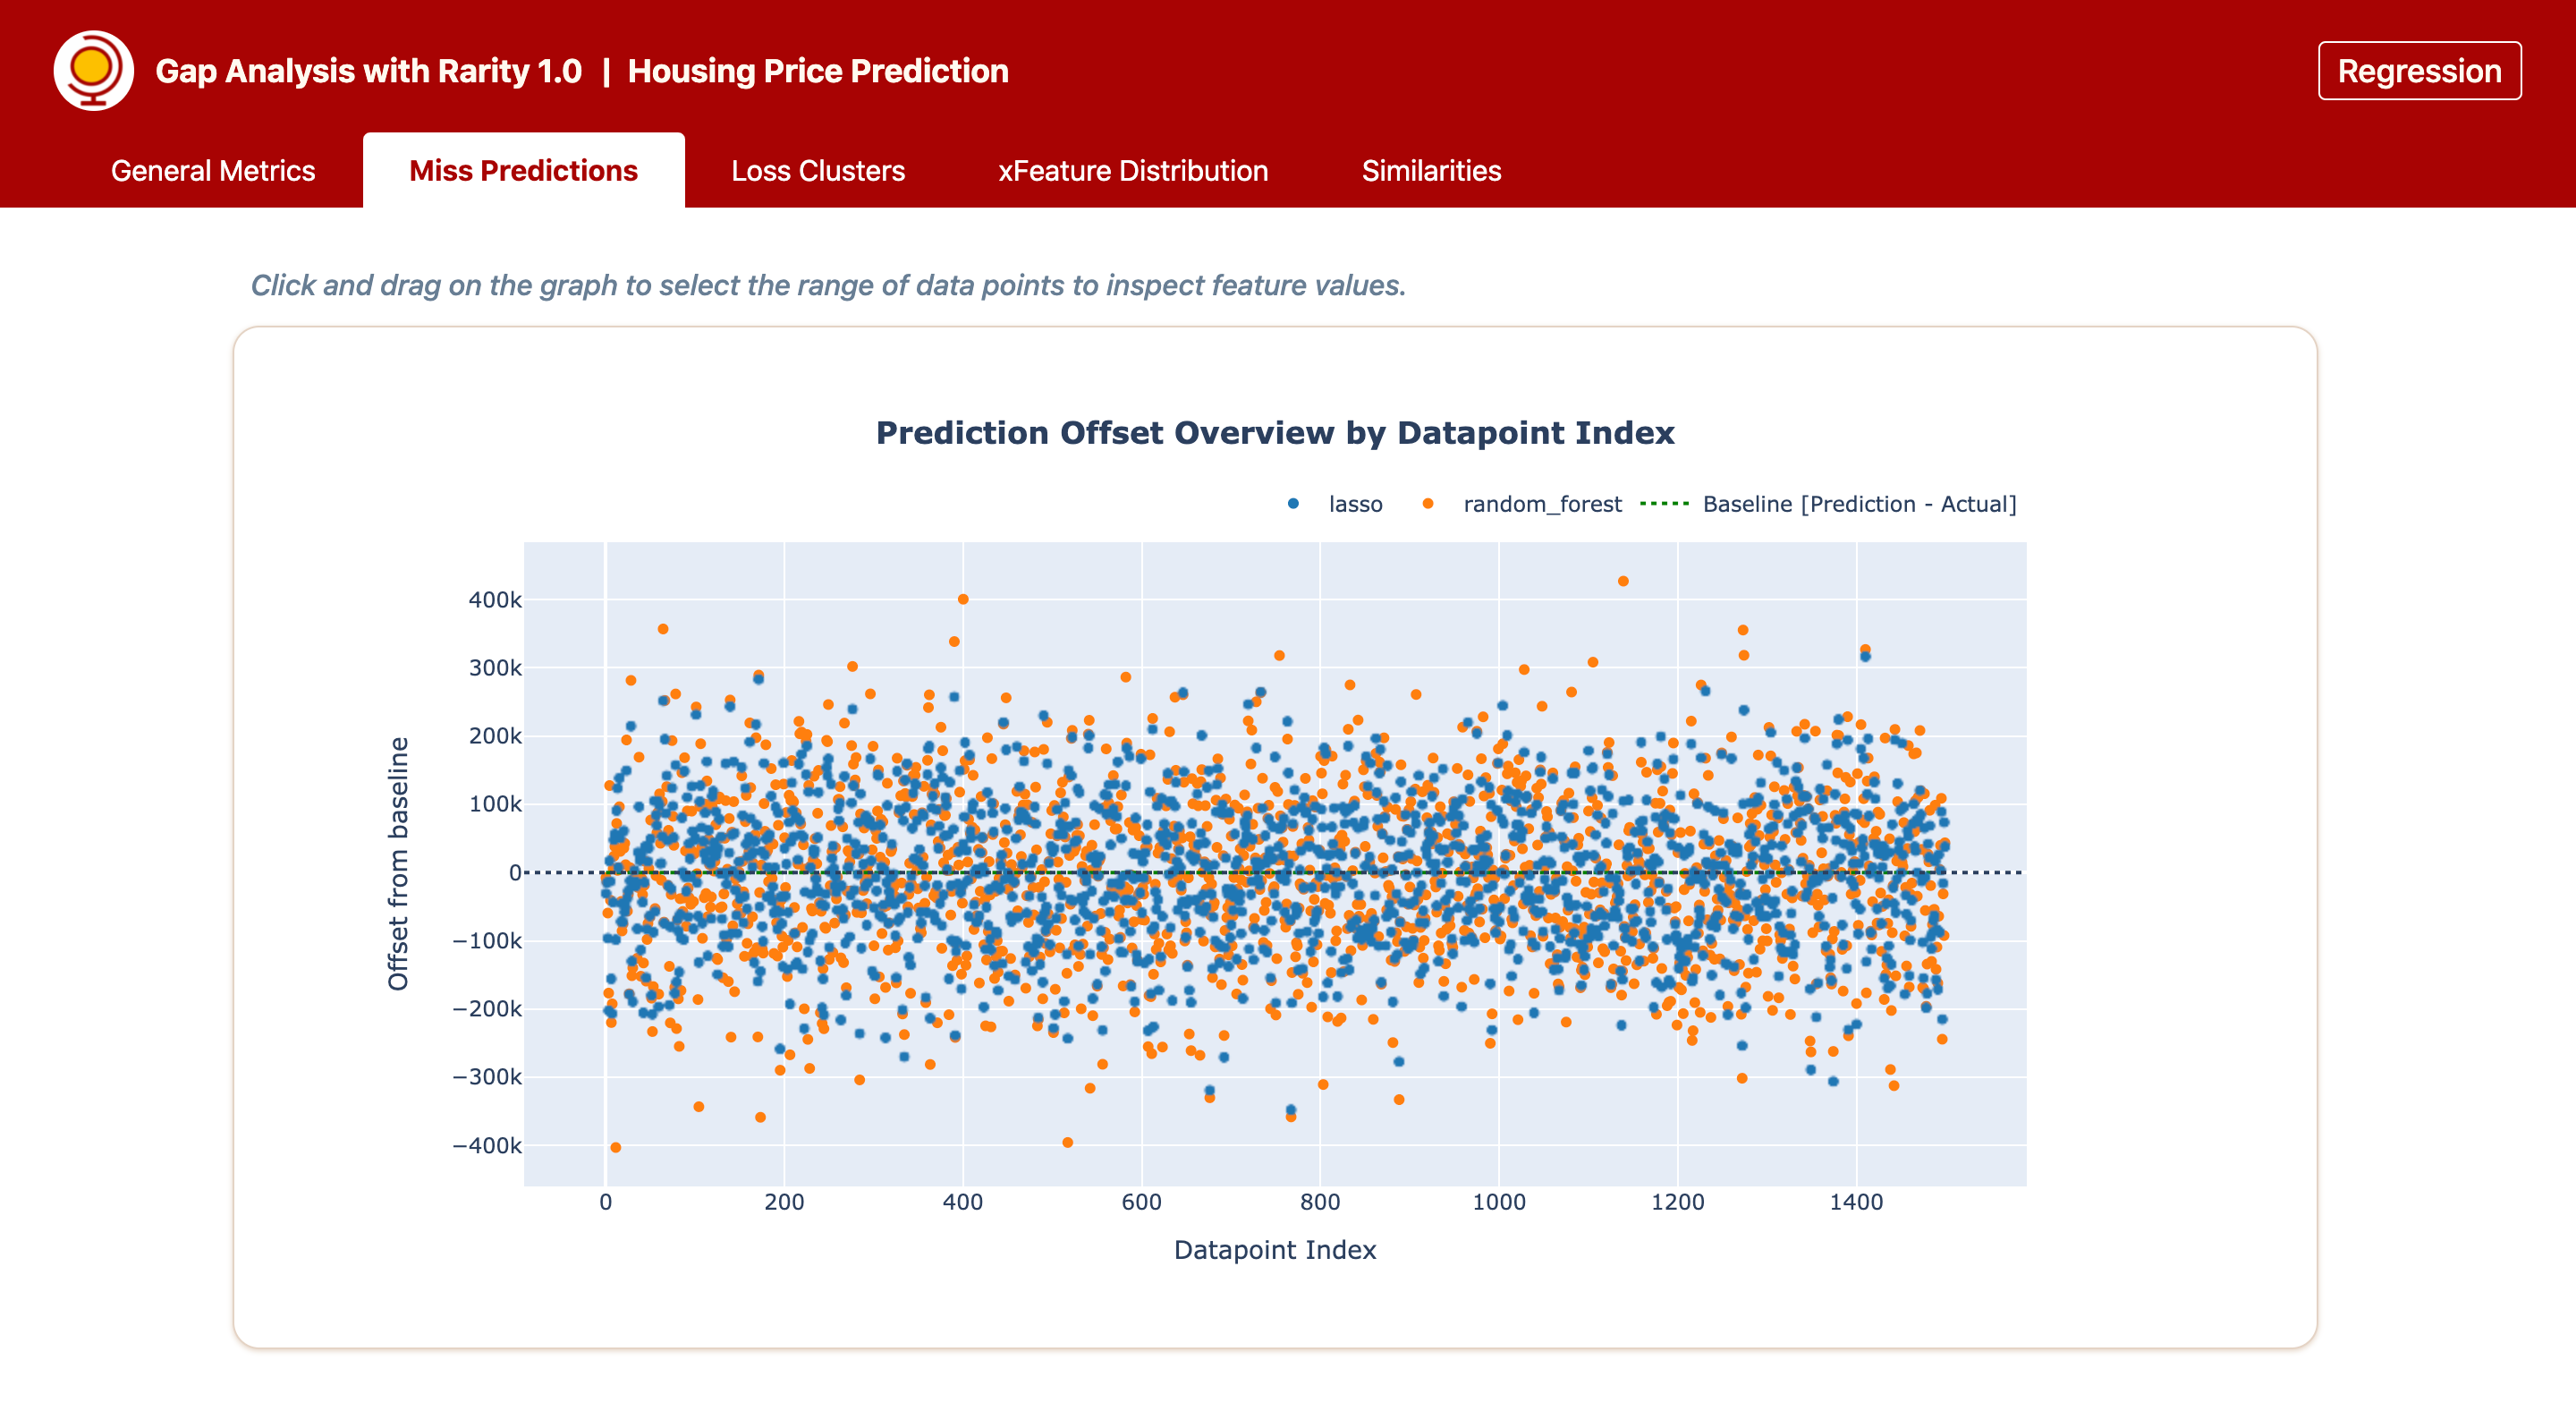
Component tab that presents miss predictions scatter plot by index number
User can select data point of interest on the plot to trigger the associated full features and prediction values for further inspection of raw data
Regression example
 ==>>
==>> 
Classifciation example
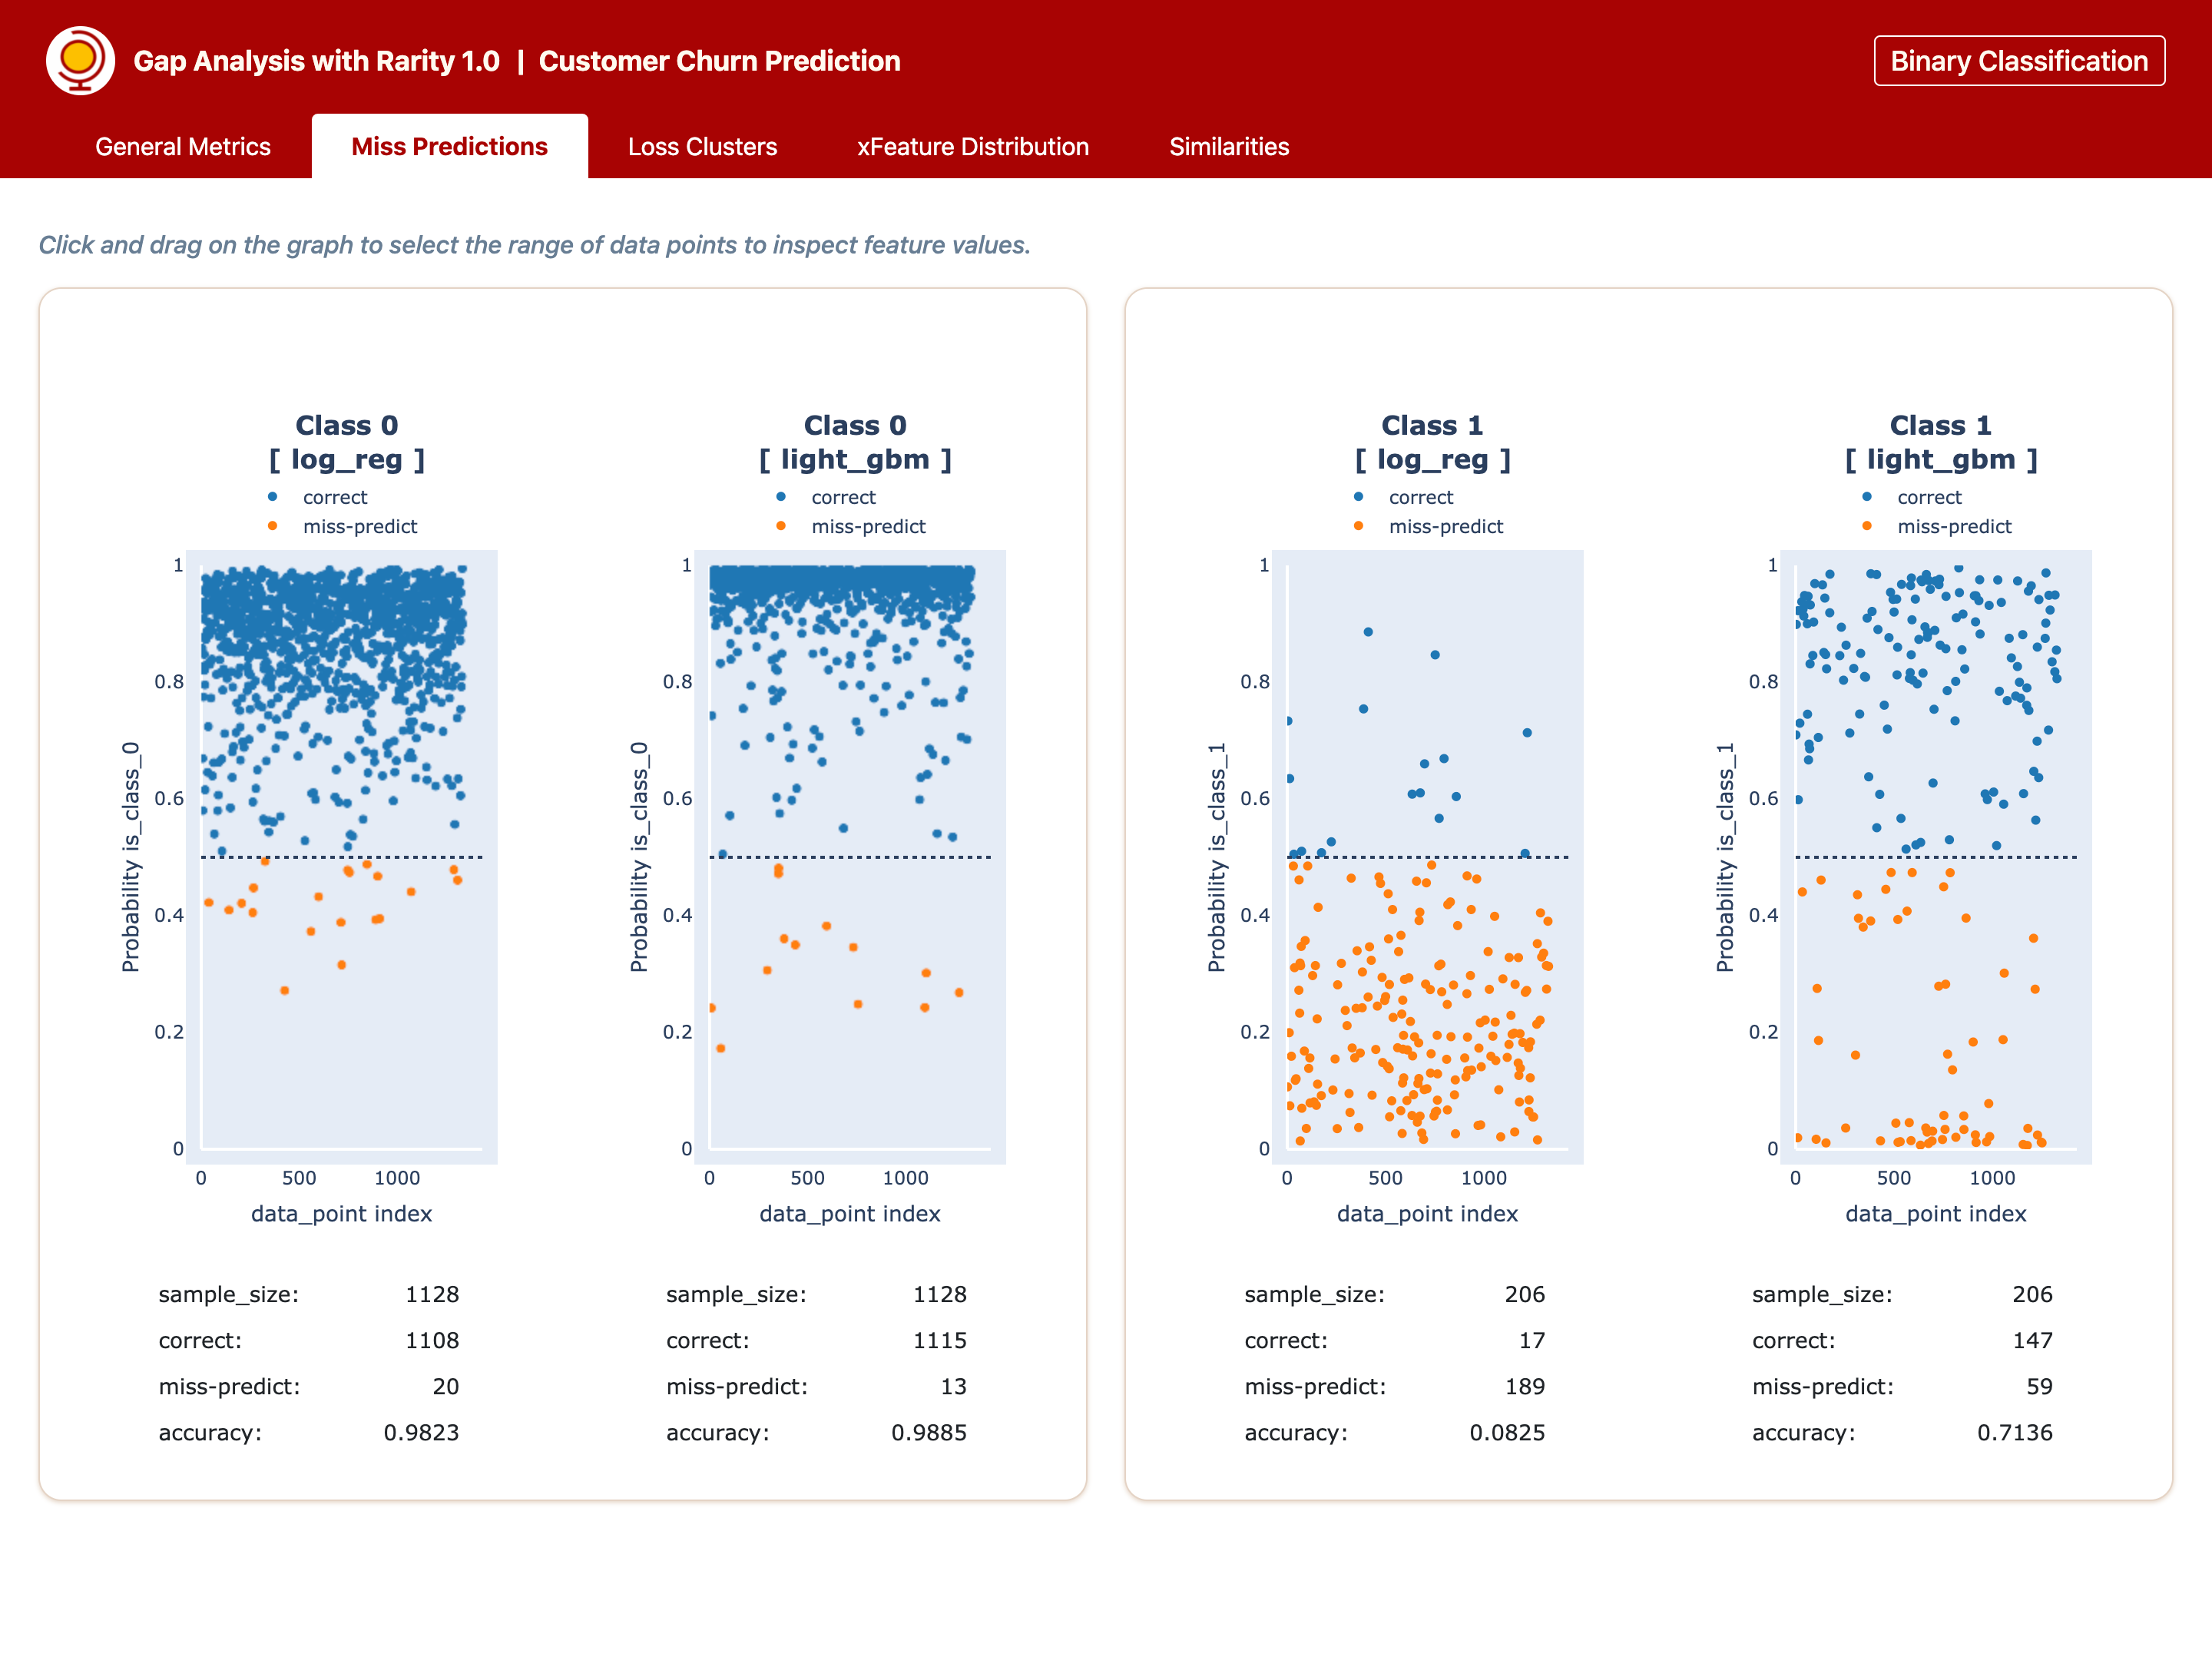 ==>>
==>> 
Loss Clusters
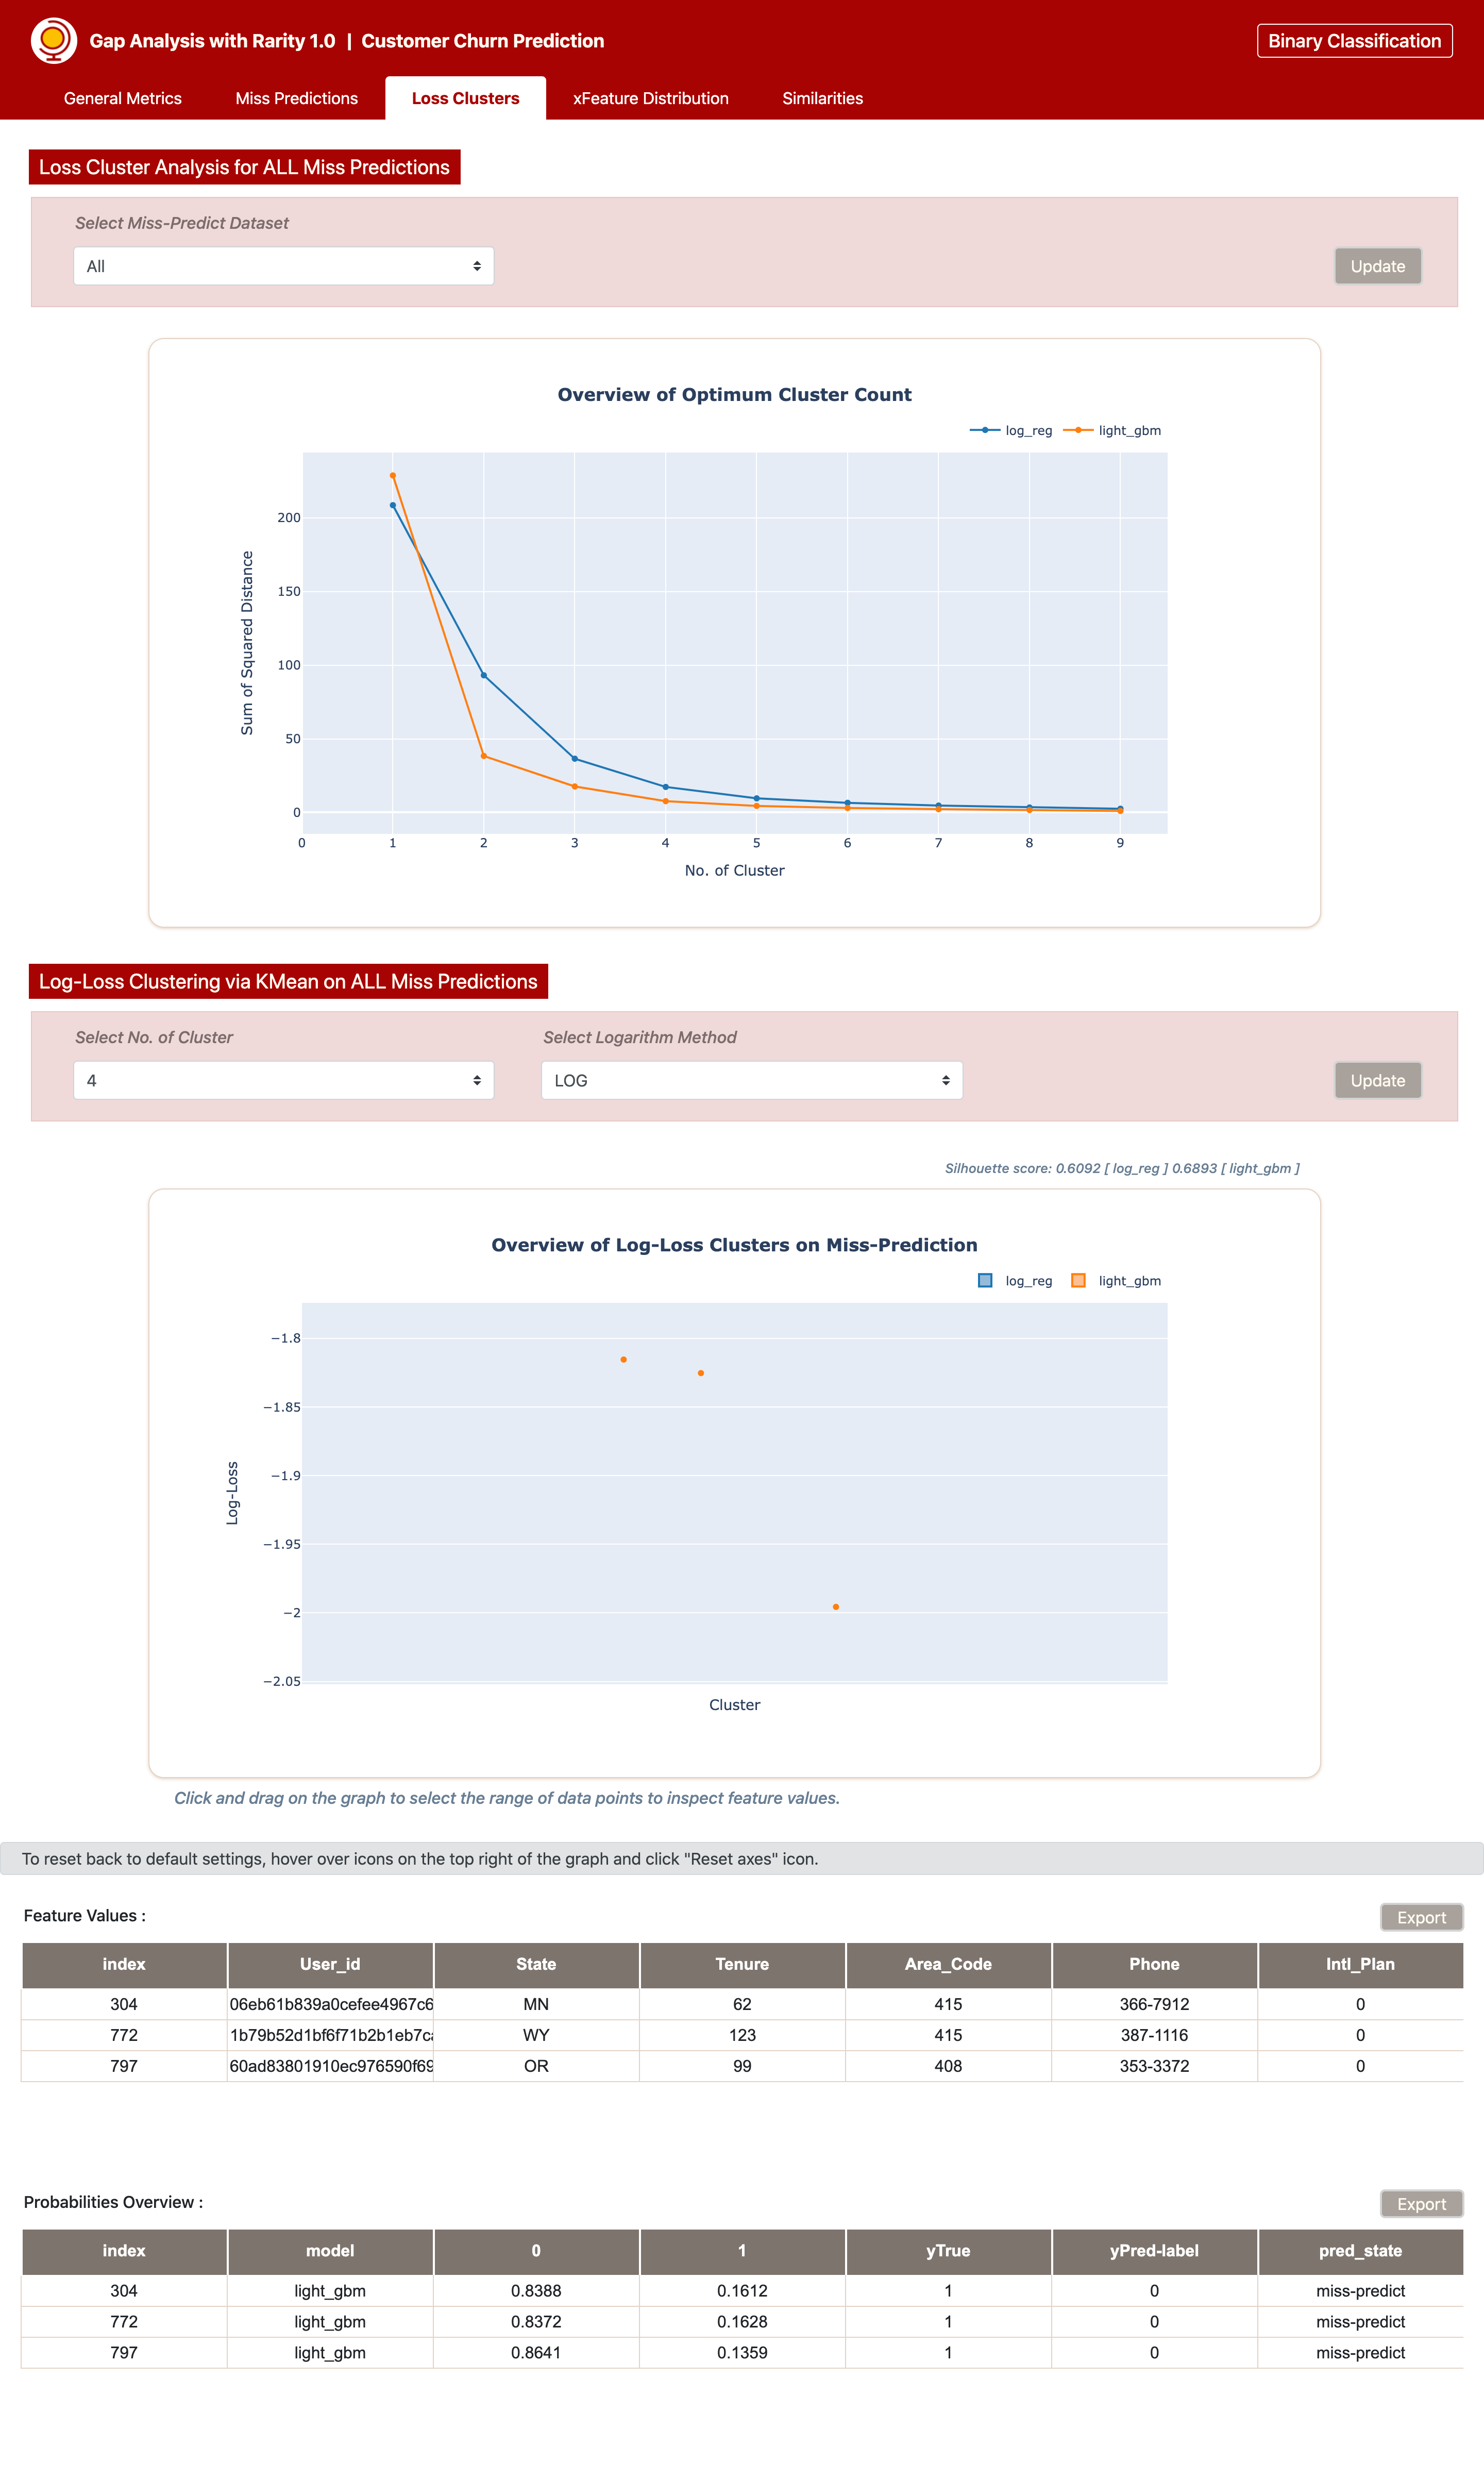
Component tab that covers clustering info on offset values (on regression) / logloss (on classification) using
KMeansto provide insights on which cluster group to focus / pioritizeA figure displaying clustering group based on elbow method is also attached to ease user finding the optimum number of cluster to form
Flexible parameter on logarithmic methods is available to allow user to select logarithmic metrics of choice
User can specifiy no. of cluster to plot and zoom in certain data point of interest to inspect the associated full features and prediction values
Example of Loss Clusters feature tab
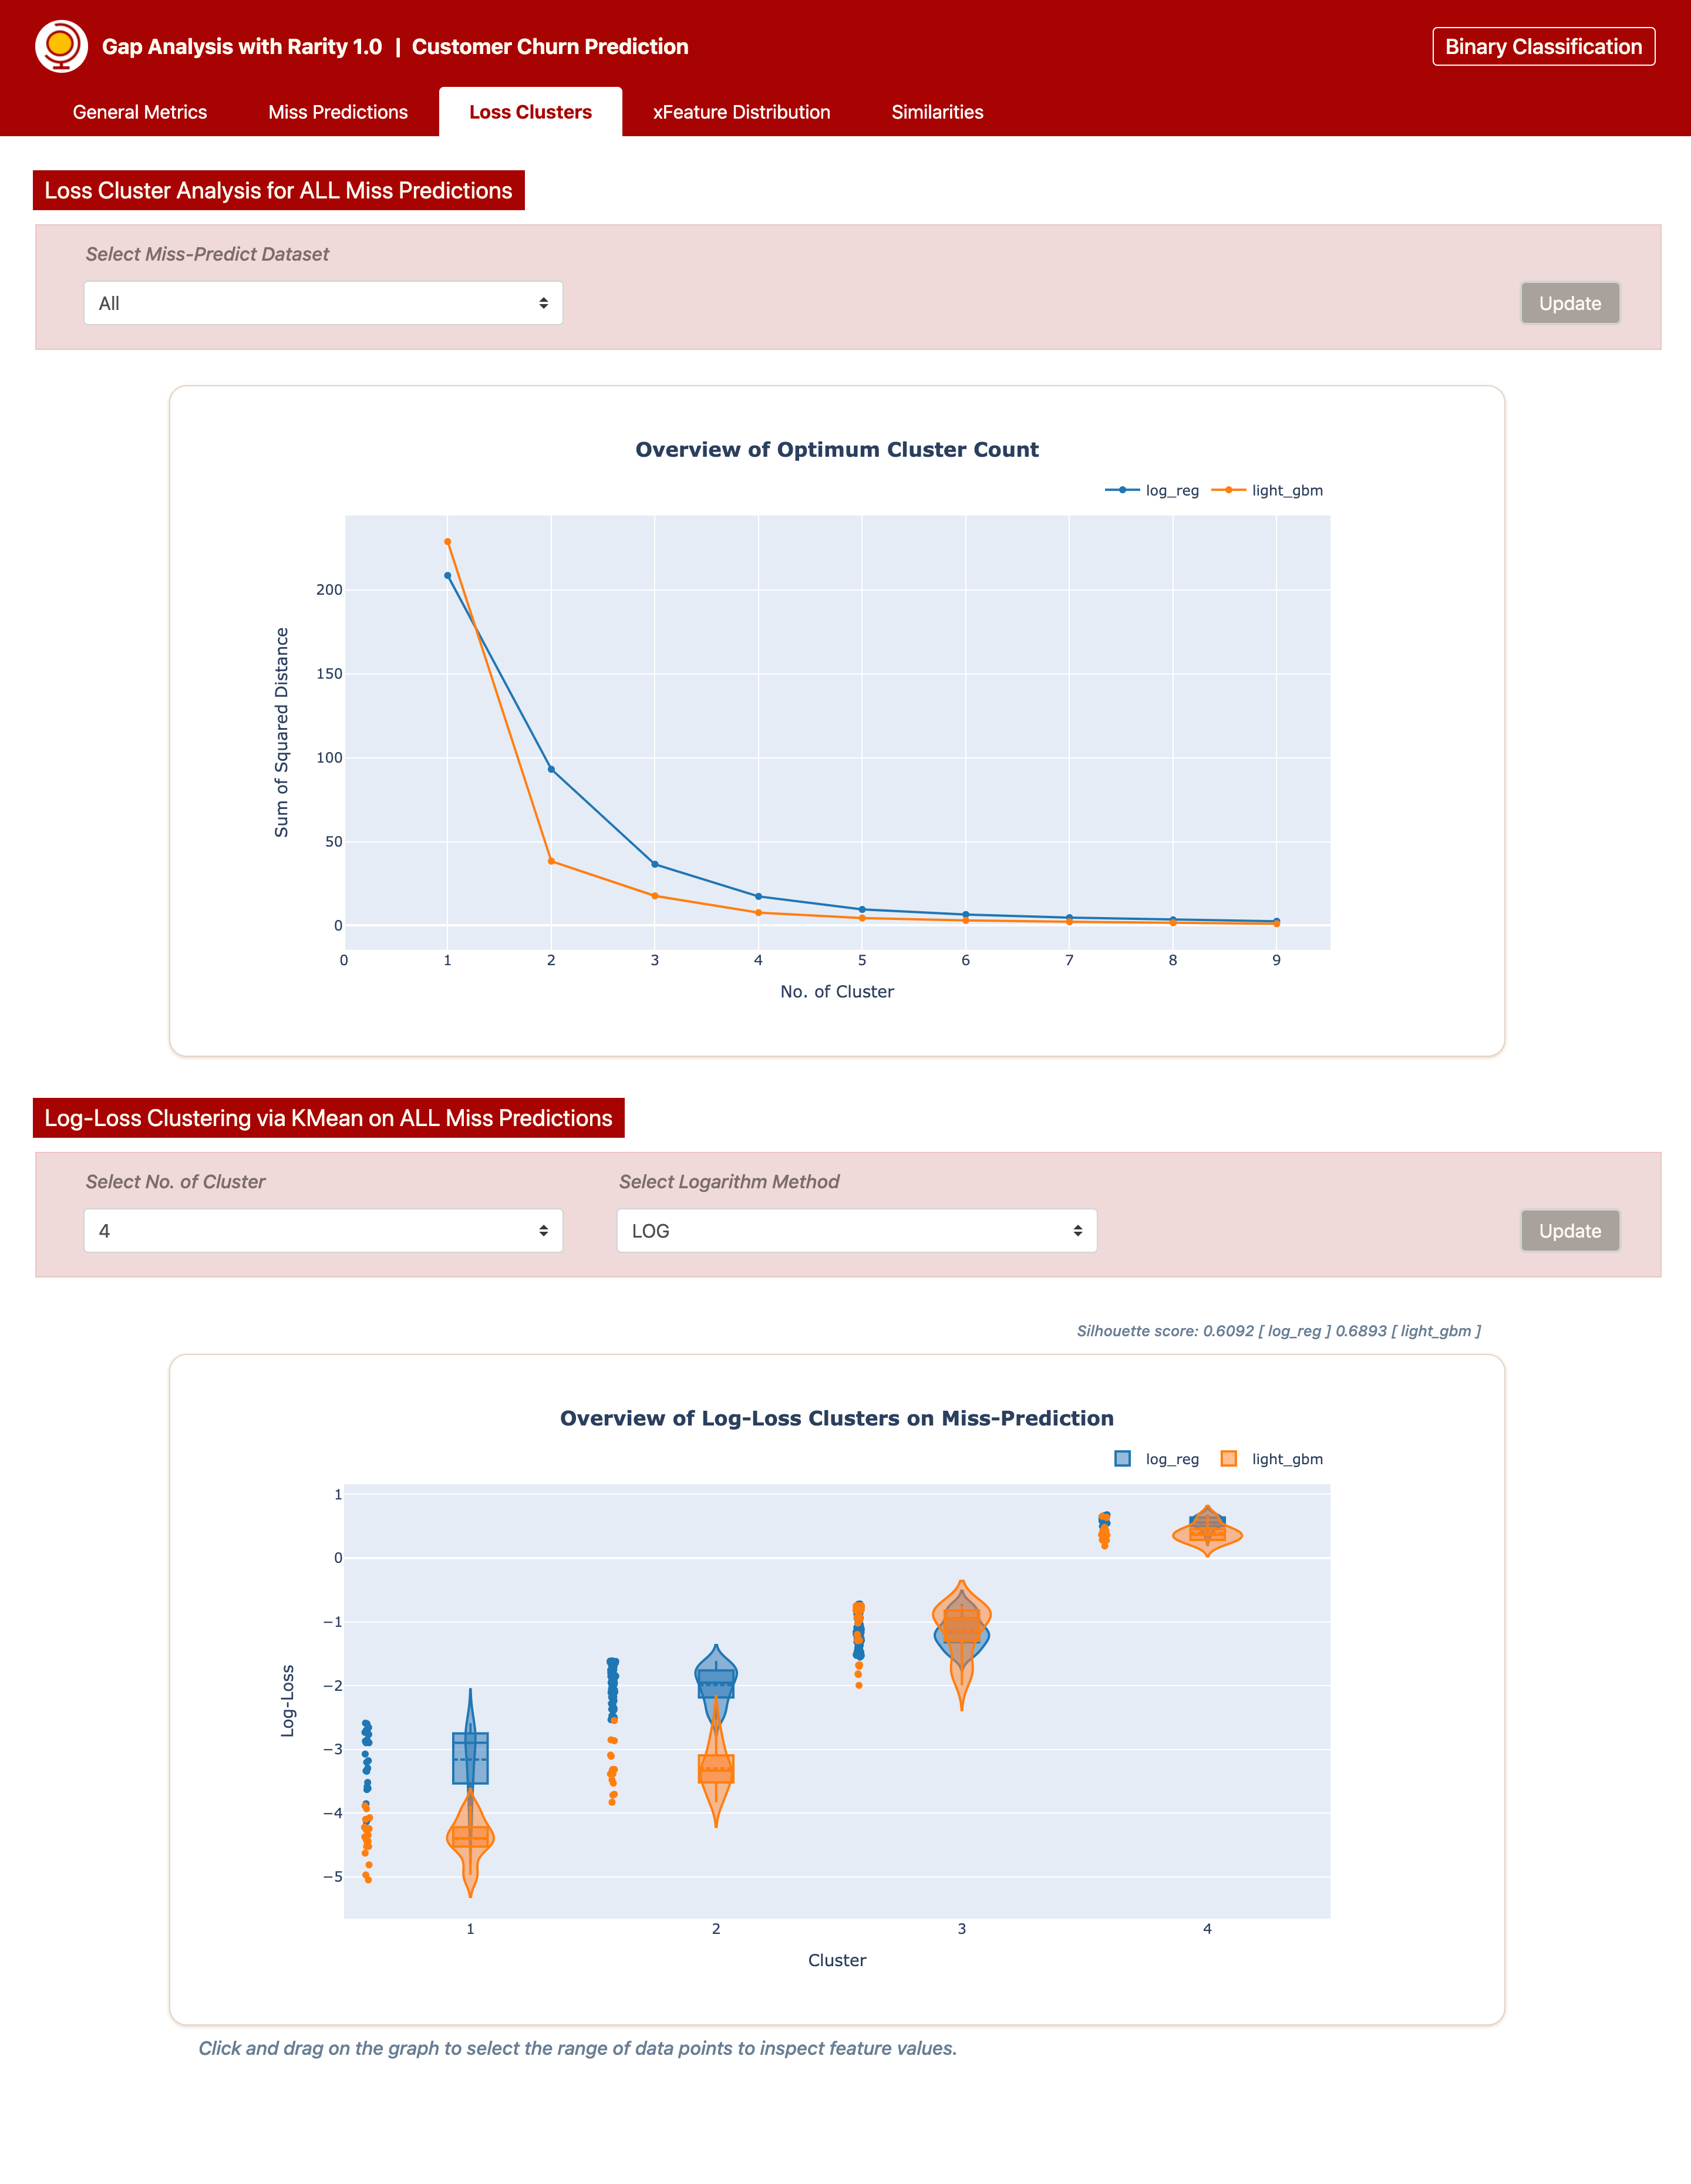 ==>>
==>> 
xFeature Distribution
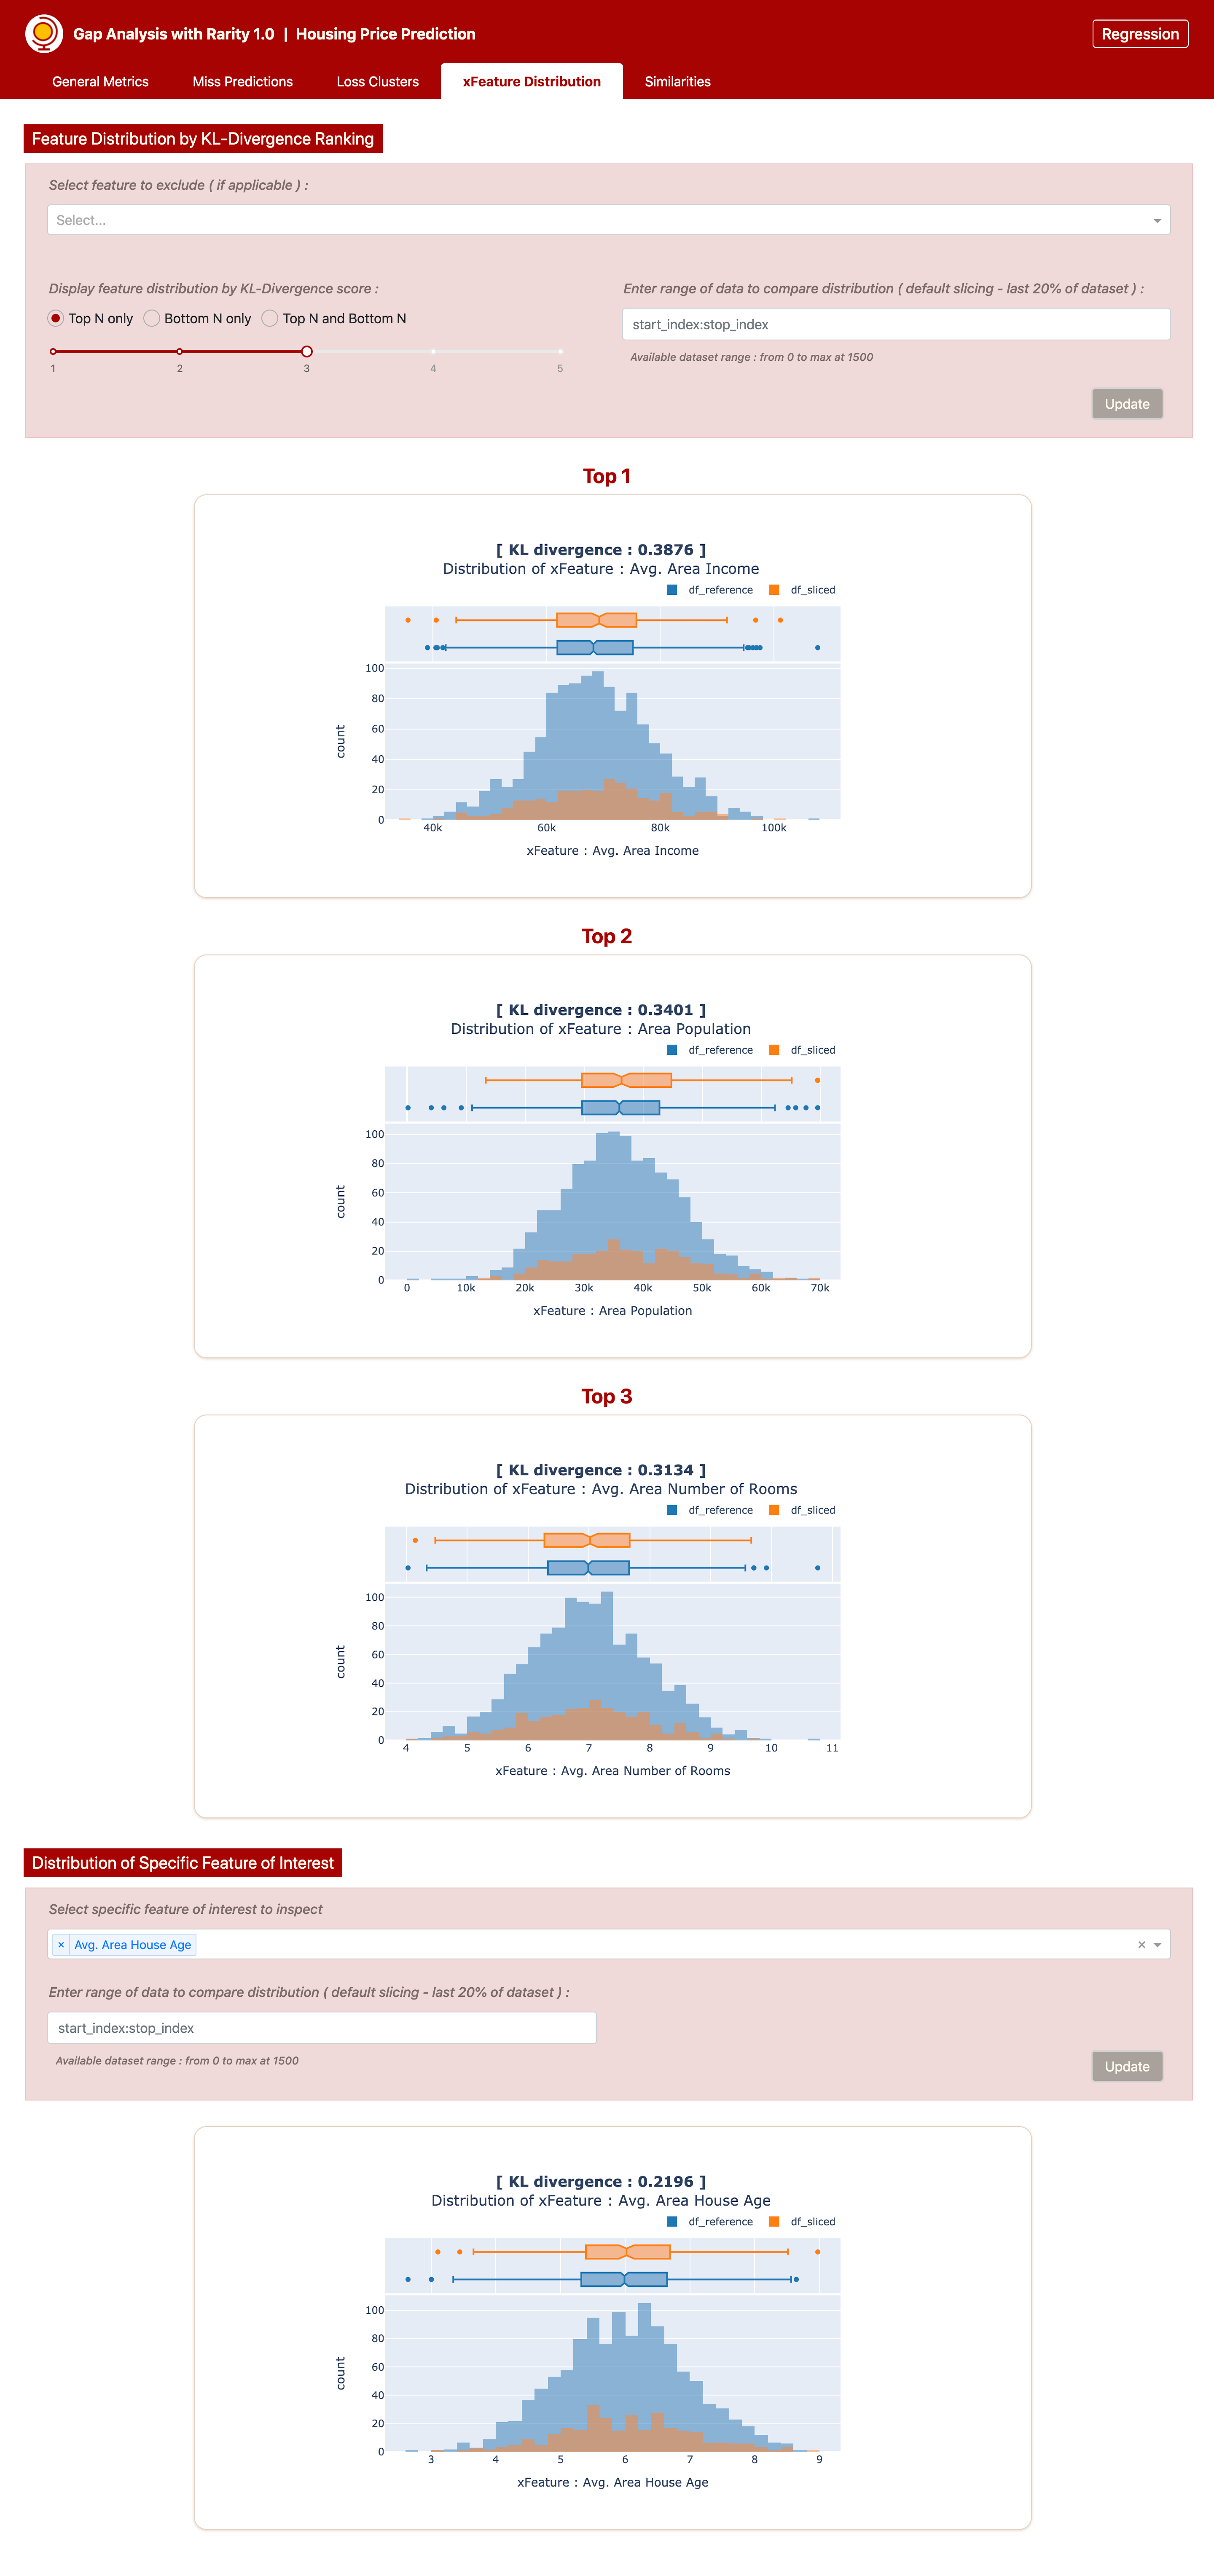
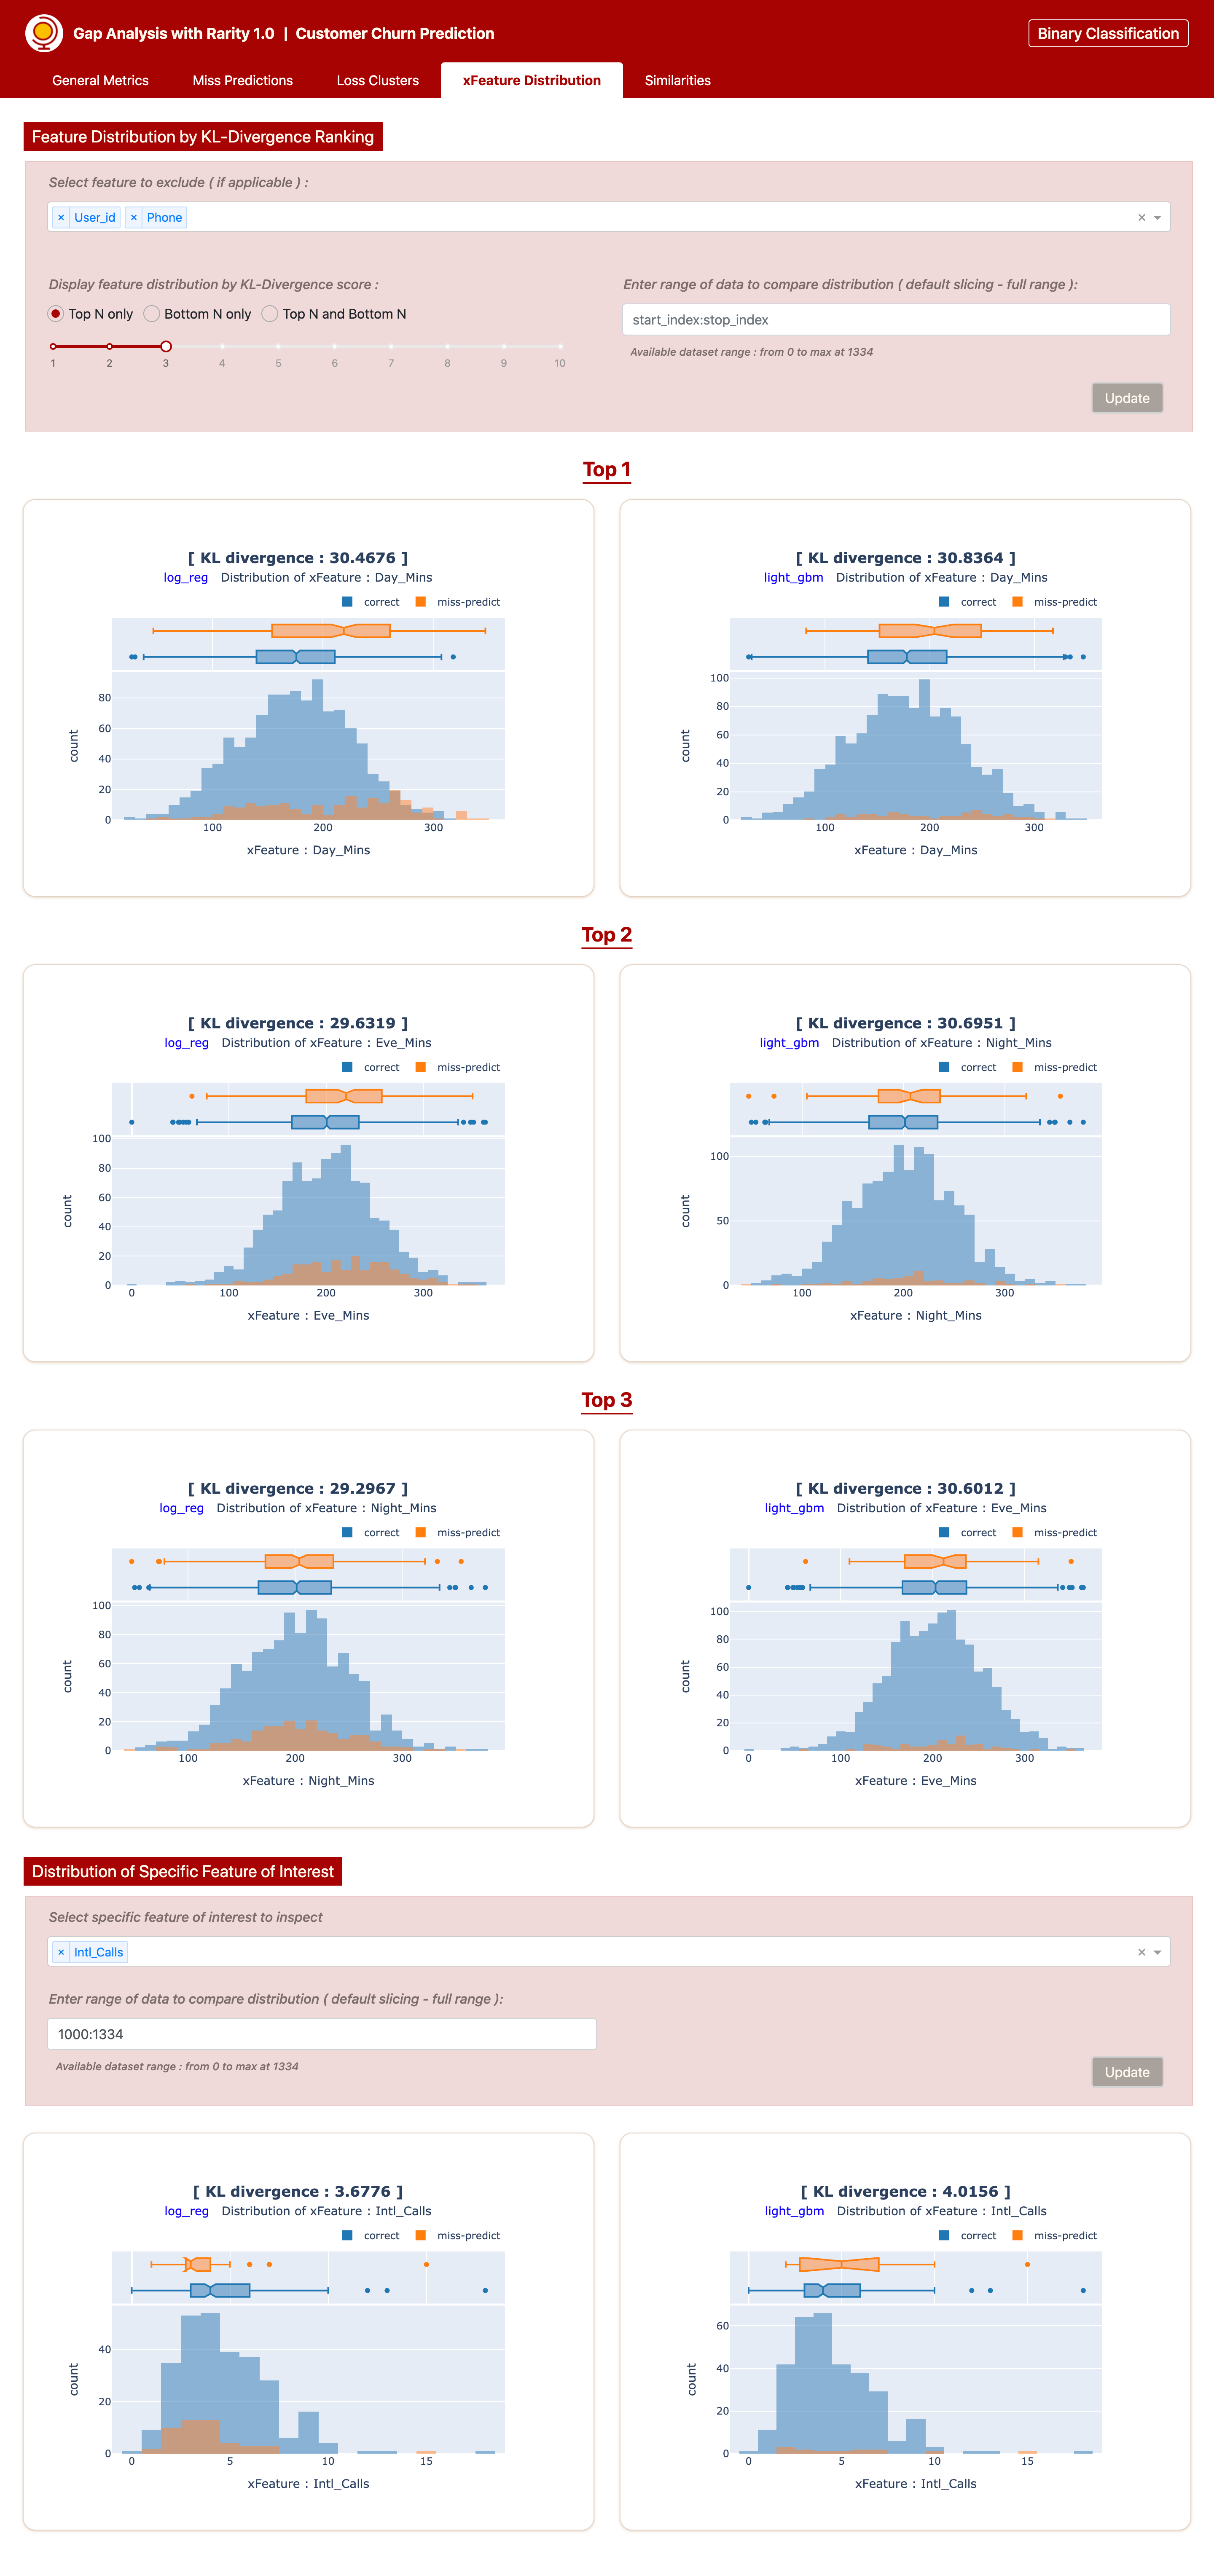
Component tab that displays distribution plots based on kl-divergence score
Flexible parameters are included to enable
exclusion of single feature or several features from being considered into the calculation of distribution ranking and display
selection to display top-n / bottom-n / both
slicing of dataframe to the range of interest
exclusively display specific feature to inspect its distribution
Example of xFeature Distribution tab for regression and classification
 <==>
<==> 
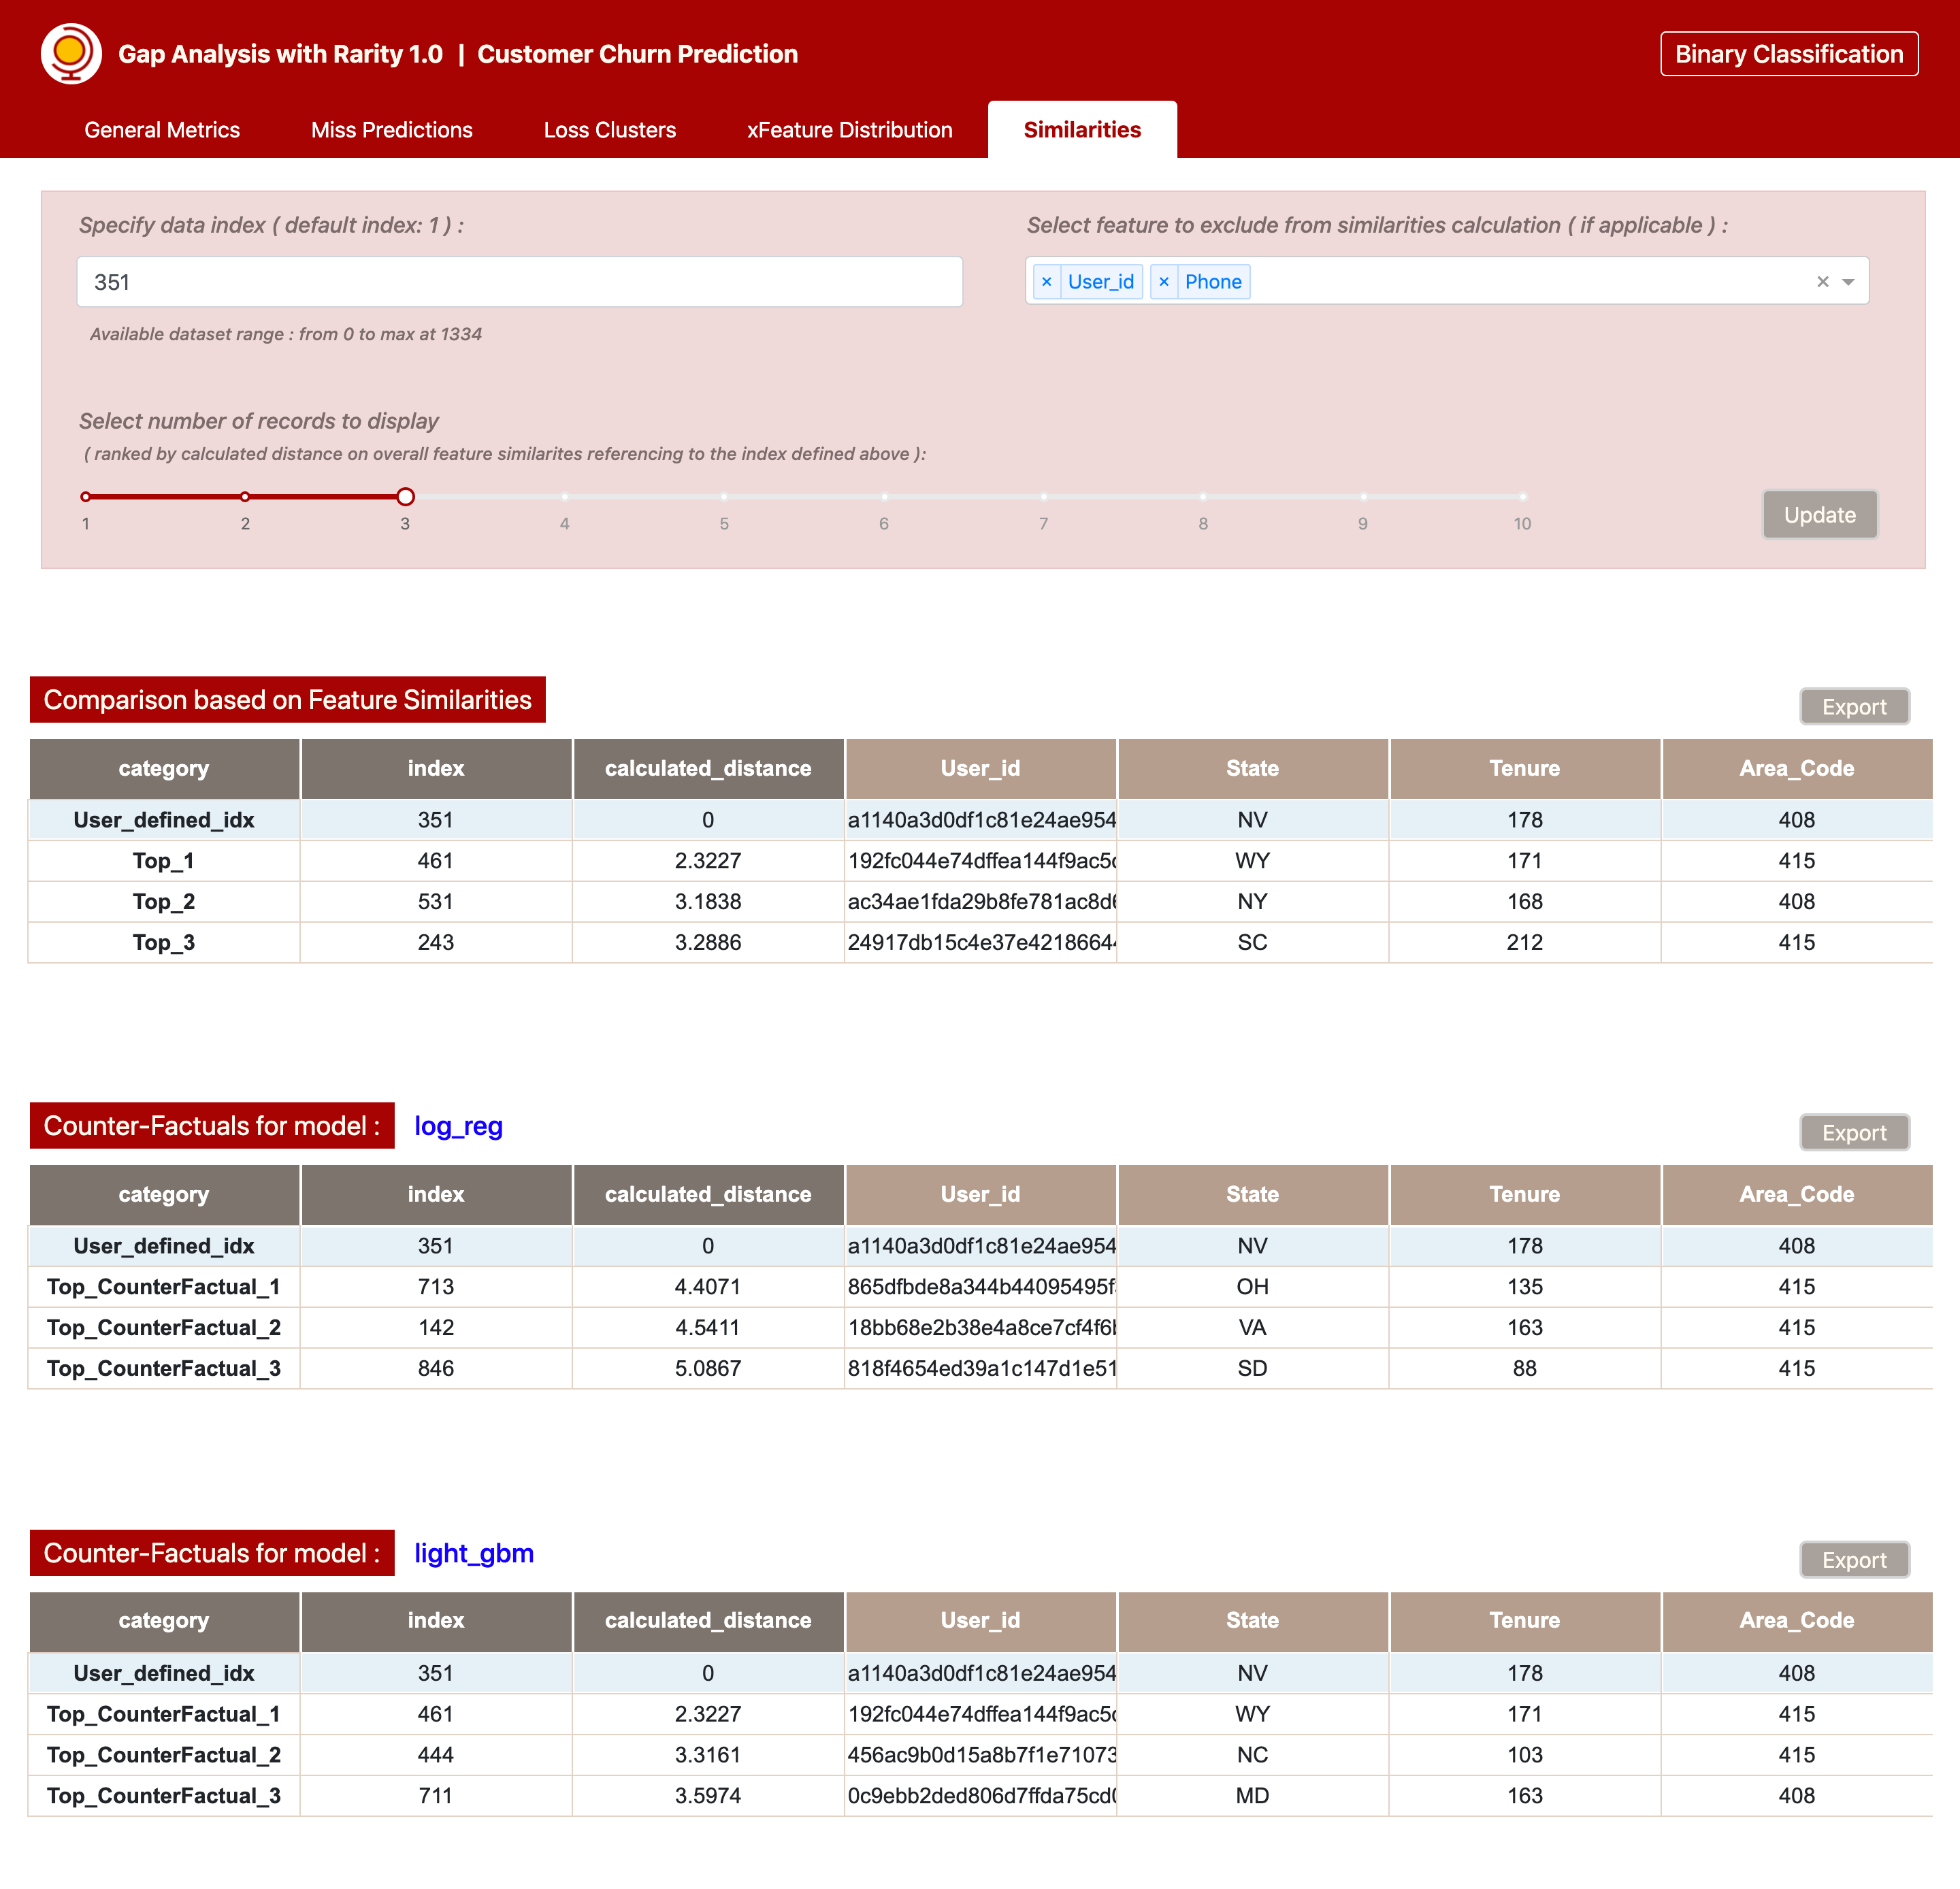
Similarities ( +CounterFactuals )
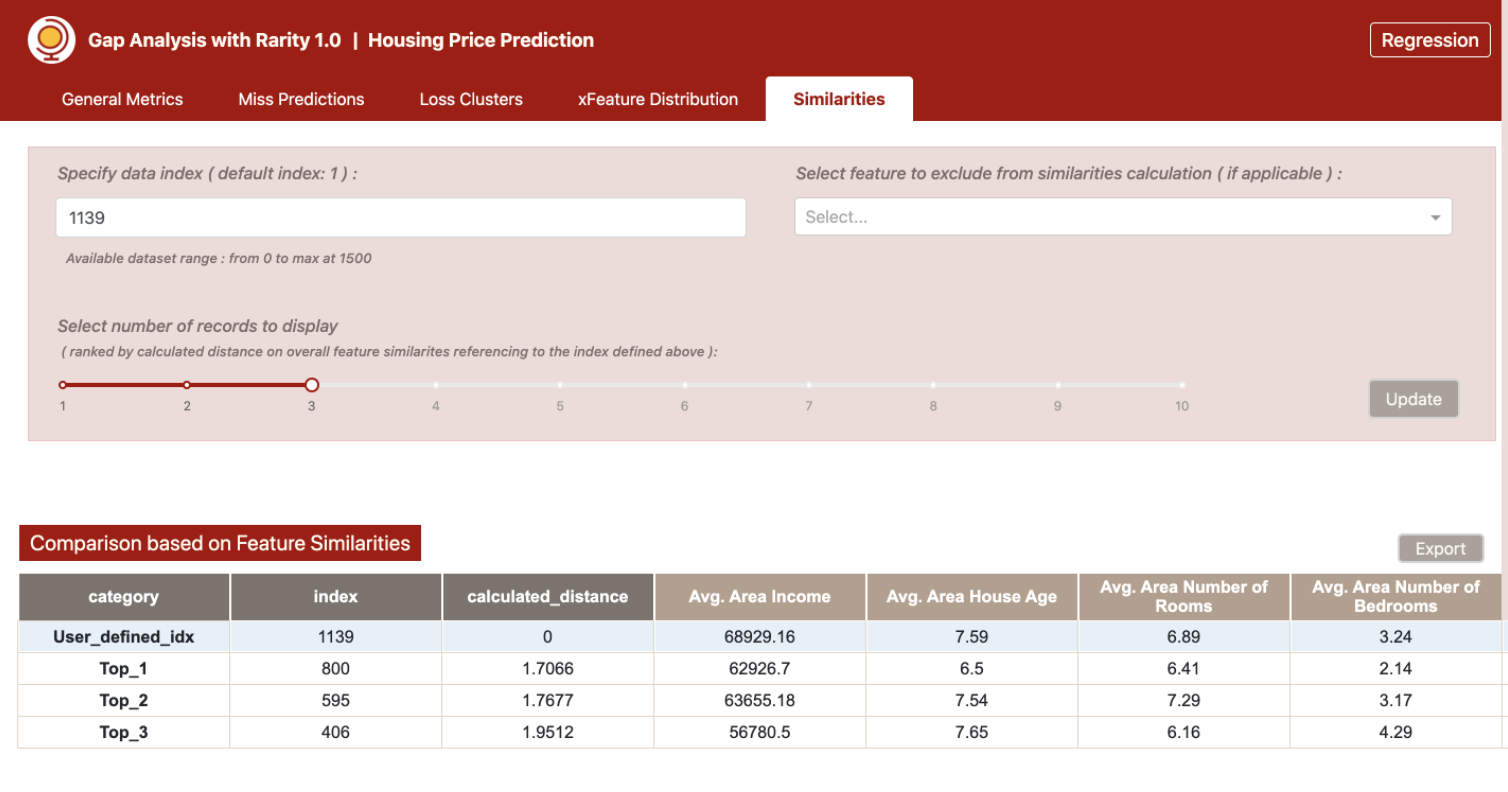
Component tab that contains tabulated info listing top-n data points based on similarities in features with reference to data index specified by user
Flexible parameters are included to enable
user to define specific data index to inspect feature similarities
selection to display upto top-10 data points that show similarities based on calculated distance score
exclusion of specific single feature or several features from being considered in the calculation of similarities
Regression example
Additional Counter-Factuals is also tabulated for classification task to better compare data points with most similar features but show different prediction outcomes.
Classification example with tabulated CounterFactuals